2016: A Year in Review — Semiconductor Equipment and Materials Market and Outlook
By Lara Chamness, senior market analyst manager, SEMI
Semiconductor Market Trends
Semiconductor revenues increased a nominal one percent in 2016 when compared to 2015 levels according to the World Semiconductor Trade Statistics (WSTS), resulting in record revenues for devices. The materials market mirrored the device market with a modest two percent increase, while the equipment market experienced robust growth of twelve percent. Even with this strong growth, the materials market remained larger than the equipment for the ninth year in a row. Overall, 2016 data played out stronger than initially forecasted at the start of the year.
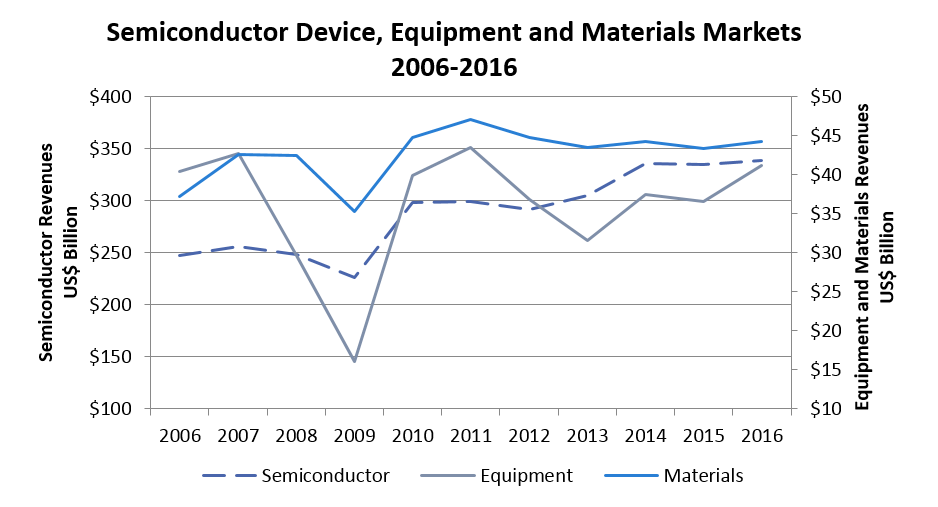
Source: Equipment and Materials, SEMI; Semiconductor, SIA-WSTS
2016 saw the strengthening of the Japanese Yen versus the U.S. dollar, especially in the second half of the year when equipment billings activity accelerated. Given the importance of Japan-headquartered suppliers in the semiconductor supply chain, the strengthening Yen boosted the growth of the global semiconductor supply chain when reported in U.S. dollars. The table (below) shows the impact of the strengthening Yen on Semiconductor Equipment Association of Japan’s (SEAJ) book-to-bill data. SEMI reveals that if the data remained in Yen, the 2016 market for Japan-based suppliers would be up five percent. However, when the Yen are converted to dollars, the 2016 equipment market for Japan-based suppliers increased 15 percent if kept at a constant conversion rate.
Semiconductor Equipment Billings of Japan-based Suppliers from SEAJ Book-to-Bill Report
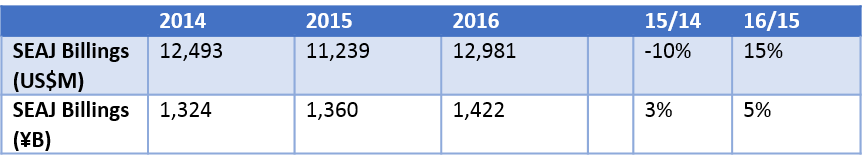
Conversion Rates: 2014 =~106 ¥, 2015 =~121 ¥, 2016 =~110
Market performance in 2015 was uneven along the supply chain in 2015 (table below). However, 2016 was a year where segments tracked by SEMI experienced growth. Additionally, 2016 saw the convergence of unit and revenues growth across the board, unlike in 2015. Semiconductor silicon shipment volumes increased three percent, marking the third consecutive record setting year for volume shipments, while silicon revenues saw a modest increase of one percent. A similar trend was exhibited by semiconductor revenues and unit shipments, semiconductor revenue increased one percent, while shipments increased 5 percent. The strengthening of the Yen against the dollar aided this market recovery.
Annual Industry Trends
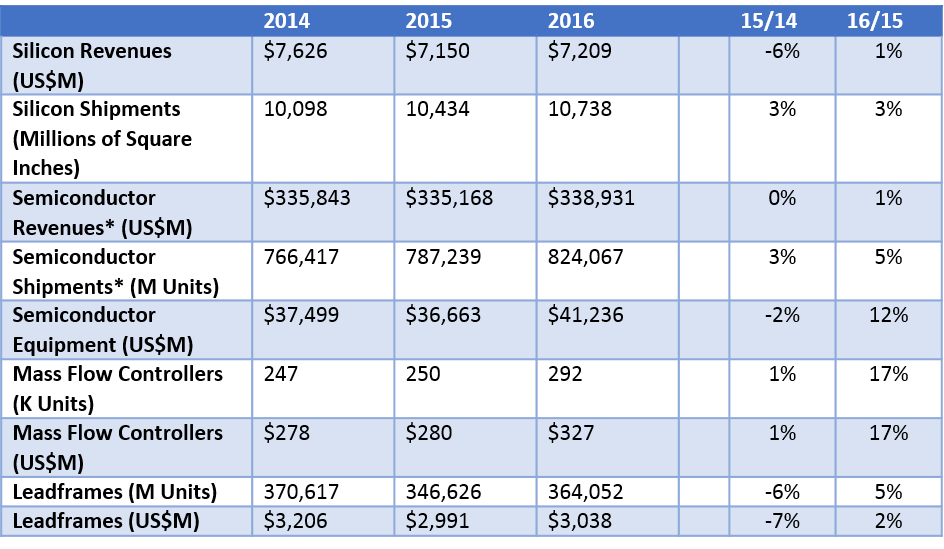
Source is SEMI, unless otherwise noted, *SIA-WSTS
Semiconductor Equipment
Worldwide sales of semiconductor manufacturing equipment totaled $41.2 billion in 2016, representing a year-over-year increase of 12 percent and placing spending just below the last market peak of $43.5 billion in 2011 but still well below the market high set in 2000 of $47.7 billion. According to SEMI, equipment sales by major equipment category, only the Other Front-end segment (Other Front End includes Wafer Manufacturing, Mask/Reticle, and Fab Facilities equipment) decreased, while Wafer Processing equipment increased 14 percent, and the Assembly and Packaging and Test equipment segments expanded 20 and 11 percent, respectively.
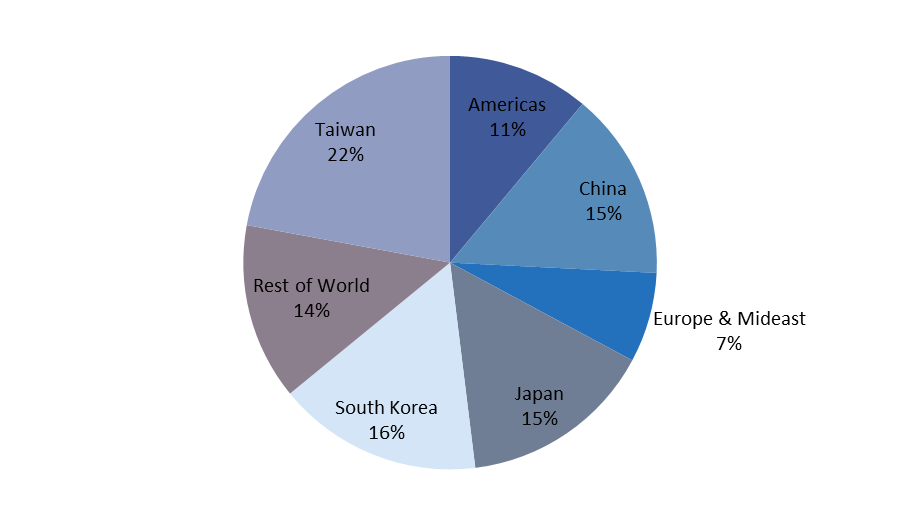
For the fifth year in a row, Taiwan retained its number one ranking last year, driven in a large part by TSMC for its 16nm ramp and impending transition to 10nm manufacturing and Micron for 20nm and 18nm capacity. South Korea held onto the second place as Samsung and SK Hynix invested heavily, while the market in China grew over 30 percent to move up in the rankings to claim the third spot. The equipment market in China was fueled by aggressive spending by Intel, Samsung, SK Hynix, SMIC, and UMC as well as strong Assembly and Packaging investments. The Japan market fell to fourth place followed closely by North America. Equipment sales to Europe and Rest of world increased 12 and 80 percent, respectively in 2016. These regions benefited from investments by Intel for its Israel and Ireland fabs and by Micron at its 3D NAND fab in Singapore. Rest of World region aggregates Singapore, Malaysia, Philippines, other areas of Southeast Asia and smaller global markets.
Semiconductor Equipment Markets – Regional Trends
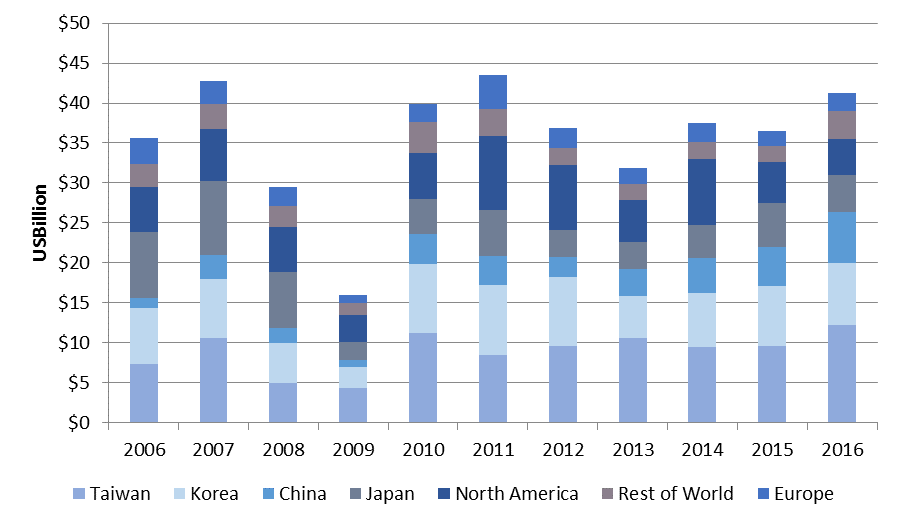
Source: SEMI/SEAJ Worldwide Semiconductor Equipment Market Statistics report
Semiconductor Materials
SEMI reports that the global semiconductor materials market, which includes both fab and packaging materials, increased two percent in 2016 totaling $44.3 billion. Looking at the materials market by wafer fab and packaging materials, the wafer fab materials segment increased three percent, while the packaging materials segment saw 1 percent growth. However, if bonding wire were excluded from the packaging materials segment, the segment would have increased two percent last year. The continuing transition to copper-based bonding wire from gold is negatively impacting overall packaging materials revenues.
Worldwide Semiconductor Materials Market
Source: SEMI, Materials Market Data Subscription, February 2017
Taiwan maintained the top spot in the materials market for the seventh year in a row, followed by South Korea, Japan, China, Rest of World, North America, and Europe (Figure above). Advanced packaging operations and foundries continue to drive the materials market in Taiwan. South Korea held onto the second position in terms of fab capacity for the second year in a row (see Figure below). The materials market in China grew the most last year to approach the size of Japan’s material market as China strengthened its domestic semiconductor manufacturing; China now accounts for 17 percent of the world’s total fab capacity without discrete (see figure below), this is an increase from 13 percent in 2015. The region also maintains a very strong position in packaging; approximately 68% of China’s total semiconductor materials market comes from packaging materials, according to SEMI.
Worldwide Fab Capacity in 2016
(Excluding Discretes)
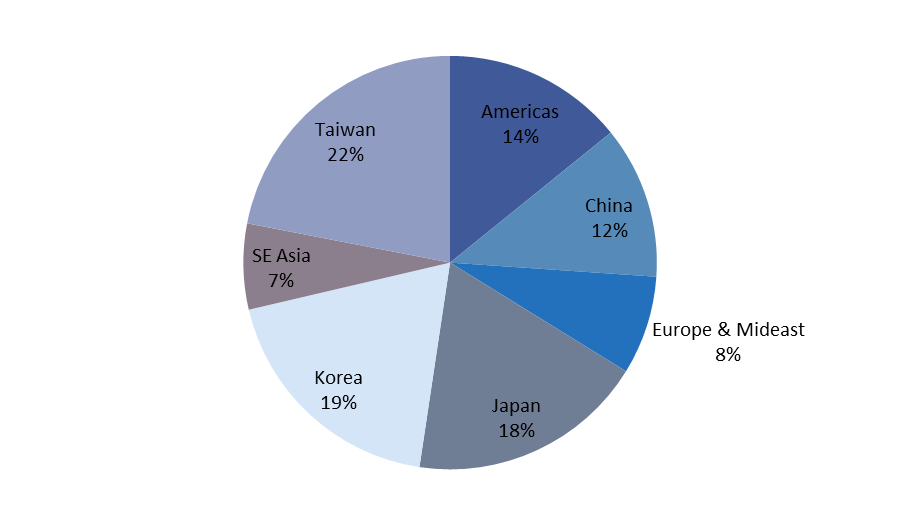
Source: SEMI World Fab Forecast, February 2017
Outlook
Market forecasts for the 2017 semiconductor market are very optimistic with projections ranging from 3 to 11 percent growth. Initial 2017 monthly data for silicon shipments, mass flow controllers, leadframes, and semiconductor equipment are proving to be strong. In light of growth expectations for the device market, SEMI projects that the semiconductor materials market will increase 2 percent this year. Given current CapEx announcements and the strong equipment order activity throughout the second half of 2016, the semiconductor equipment outlook is optimistic as well. Current projections for equipment market growth are in the low teens for the year, which would place the equipment market on above the last market high in 2011 but below the industry high-water mark set in 2000.
2016 represented a return to modest growth in the industry with both unit and revenue growth converging for all segments tracked and positive growth up and down the supply chain, although growth was uneven across regions. The strengthening Yen and demand for semiconductors positively impacted the device, equipment, and materials segments. 2017 is promising to be another growth year for the semiconductor supply chain with device, materials and equipment suppliers expecting increases for the year.
Portions of this article were derived from the SEMI Worldwide Semiconductor Equipment Market Statistics (WWSEMS), the Material Market Data Subscription (MMDS) and the World Fab Forecast database. These reports are essential business tools for any company keeping track of the semiconductor equipment and material market. Additional information regarding this report and other market research reports is available at www.semi.org/marketinfo.
Global Update
SEMI
www.semi.org
April 18, 2017