
Semiconductor Market Trends
For the semiconductor industry, 2018 was nothing if not incredible. Chip revenue shot up to $469 billion, trouncing the record-setting $412 billion reached in 2017 to reach a new high. Both semiconductor equipment and materials hit record revenues of $65 billion and $52 billion, respectively. And in a remarkable industry trifecta, all three segments logged their third consecutive year of growth – a run not seen since the mid-1990s.
2018 opened with semiconductor revenue forecasts averaging 9 percent growth, a level that gave way to a 14 percent increase as demand remained solid and device average selling price stayed stable to cap a third consecutive year of record revenues, according to the World Semiconductor Trade Statistics (WSTS). And while memory investments moderated, expenditures in China more than compensated with equipment growth of 14 percent, pushing the equipment market to $65 billion, past the historic $57 billion high set the previous year. What’s more, in 2018 the materials market finally surpassed its 2011 market high of $47 billion.
Semiconductor Device, Equipment and Materials Markets 1992-2018
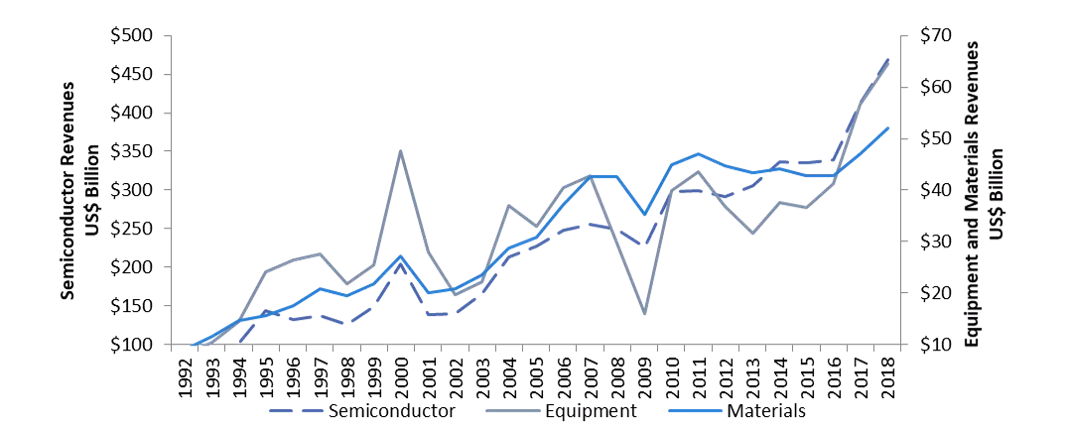
Source: Equipment and Materials, SEMI, April 2019 - Semiconductor, SIA-WSTS, February 2019
Semiconductor Equipment
Worldwide sales of semiconductor manufacturing equipment totaled $64.5 billion in 2018, a year-over-year increase of 14 percent, setting a new record. According to SEMI, all equipment sales by major equipment category rose: Test equipment segments increased 20 percent, and wafer processing equipment grew 15 percent. Other front end segments – including wafer manufacturing, mask/reticle, and fab facilities equipment) – and assembly and packaging expanded 9 percent and 2 percent, respectively.
South Korea retained the top spot in equipment rankings for the second year in a row, while China climbed to the second spot for the first time, displacing Taiwan, which fell to the third position. The rate of equipment spending dropped 12 percent last year in Taiwan as TSMC, UMC and other companies in the region reigned in equipment expenditures and further diversified their investments in China. China continued its ambitious spending with 59 percent year-over-year growth, an upsurge fueled by aggressive investments by Intel, Samsung, SK Hynix, TSMC, SMIC, Huahong Group, Yangtze Memory Technology, and Hefei Chang Xin (RuiLi) Innotron, as well as strong test, assembly and packaging spending.
Japan and North America maintained the fourth and fifth positions, respectively, last year, while Japan set an all-time regional high of $9.47 billion, surpassing the previous record of $9.31 billion in 2007. Europe stayed in the sixth position, posting 15 percent growth as Intel, GLOBALFOUNDRIES, Infineon, and Texas Instruments accelerated investments in the region. The Rest of World region – an aggregate of Singapore, Malaysia, Philippines, other areas of Southeast Asia and smaller global markets – remained in the seventh position though Southeast Asia outgrew some other regions with a 25 percent investment increase in 2018 driven by memory and power semiconductor projects.
Semiconductor Equipment Markets – Regional Trends
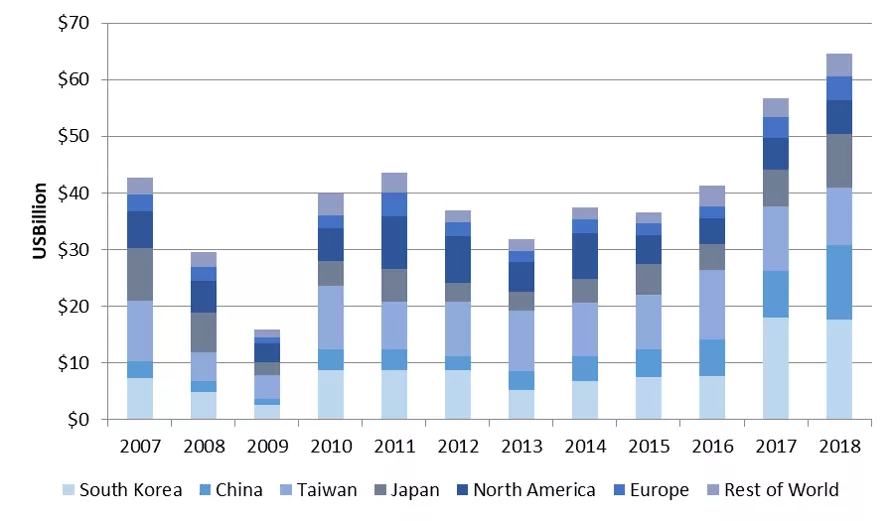
Source: SEMI/SEAJ Worldwide Semiconductor Equipment Market Statistics report, April 2019
Semiconductor Materials
The global semiconductor materials market, which includes both fab and packaging materials, jumped 11 percent in 2018 to $51.9 billion, with the wafer fab materials segment growing 16 percent and the packaging materials segment 3 percent. Headwinds facing the packaging materials market are disproportionately impacting bonding wire and substrates, which include the continuing transition to copper-based bonding wire from gold, the adoption of fan-out wafer-level packaging, and the use of a coreless structure based on a modified leadframe.
The large year-over-year increase for the wafer fab materials market was driven largely by strength in silicon pricing, although aggregate average silicon pricing per square inch remained well below 1990s levels. So while silicon revenues increased 31 percent last year, they fell significantly short of their market high of $12 billion set in 2008, despite shipping at record volumes.
Worldwide Semiconductor Materials Market
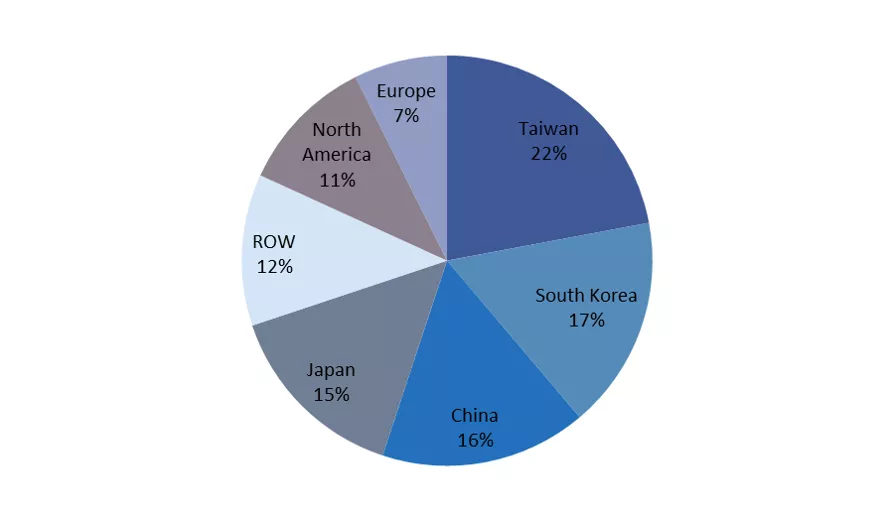
Source: SEMI, Materials Market Data Subscription, April 2019
Taiwan maintained the top spot in the materials market for the eighth year in a row, while South Korea jumped in the rankings to claim the second spot on the strength of wafer fab materials consumption. China fell to the third position followed by Japan, Rest of World, North America, and Europe (figure above). Advanced packaging operations and foundries continue to drive the Taiwan materials market. The materials market in Rest of World is dominated by packaging materials, while the materials market in North America is weighted heavily toward fab materials.
2019 Outlook
While initial forecasts for 2019 semiconductor revenue growth averaged in the low single-digits, recent industry data has prompted multiple restatements with projections ranging from -7 percent to -3 percent growth. The bearish outlook is supported by weakening 2019 monthly data for silicon shipments, mass flow controllers, leadframes, and semiconductor equipment. With these dampened expectations for the device market, SEMI projects that the semiconductor materials market will grow 2 percent this year. The outlook for the semiconductor equipment market is also negative due to recent capital expenditure announcements. If the 2019 forecast for equipment market growth in the low negative teens materializes, the equipment market will roughly match 2017 growth.
Portions of this article were excerpted from the SEMI Worldwide Semiconductor Equipment Market Statistics (WWSEMS) a part of the Equipment Market Data Subscription and the Material Market Data Subscription (MMDS). These reports are essential business tools for any company tracking the semiconductor equipment and material market. Additional information about these and other market research reports is available at www.semi.org/marketinfo.
Lara Chamness is a senior market analyst in Industry Research and Statistics at SEMI.