
World Electronic Supply Chain Third Quarter Growth
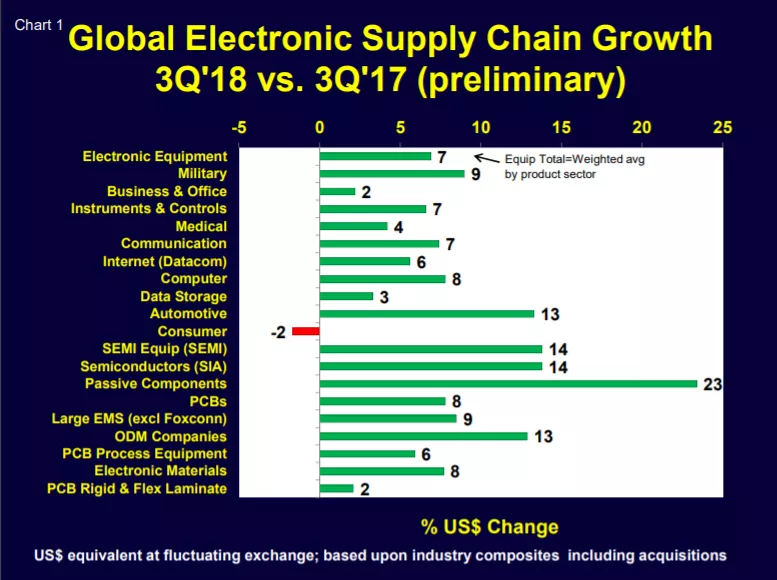
Chart 1 is our preliminary estimate of US$ denominated growth by sector of the global electronic supply chain in 3Q’18 vs 3Q’17. For most sectors, consolidated financial reports of companies producing similar products were used to calculate growth.
This chart is still an early estimate as not all companies in our analysis have reported their calendar third quarter financials but historically our early estimates have been reasonably close to the final results. We will update this chart next month.
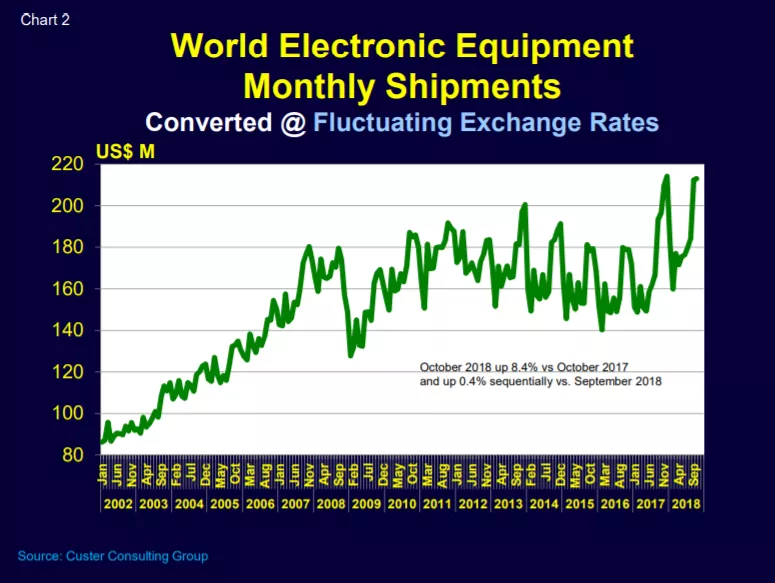
Based on consolidated regional data, electronic equipment shipments are approaching their seasonal peak for this year (Chart 2). October 2018 was up 8.4% compared to October 2017 but only up 0.4% sequentially from September 2018. As the consumer-driven “busy season” winds down at year end, electronic equipment and component monthly sales will decline until late next spring.
Wafer Foundry vs. Semiconductor Sales Strong through Third Quarter
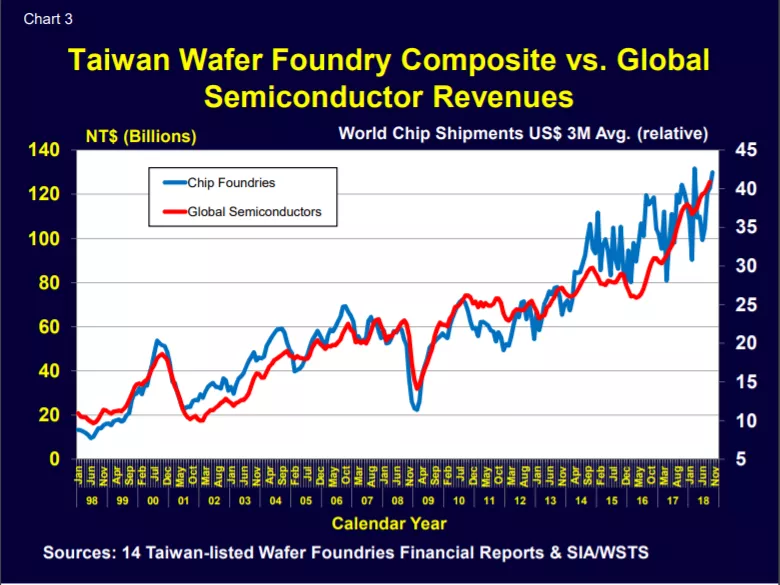
Global semiconductor and Taiwan wafer foundry monthly revenues remained strong in late 2018 as foundry sales almost set a record in October (Chart 3). We can likely expect that both these series will show slower growth soon.
Eurozone
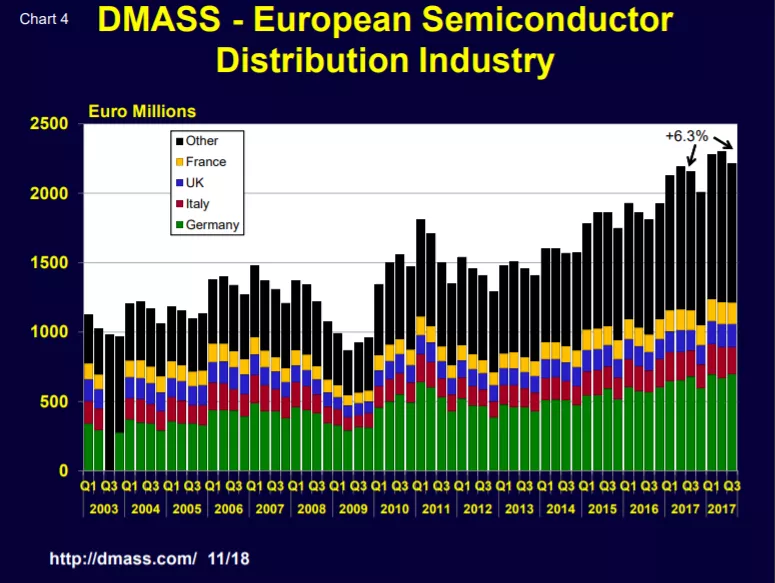
In the Eurozone, DMASS sales for the European semiconductor distribution industry increased 6.3% in 3Q’18 vs. 3Q’17 (Chart 4).
Quoting Georg Steinberger, chairman of DMASS:
“So far, 2018 has proved to be a healthy mid-single-digit growth year for the European semiconductor distribution industry with product shortages and price increases continuing through the summer. Compared to the double-digit projections we keep seeing for the total European semiconductor market from WSTS and others, European distribution does not seem to enjoy the same dynamics. However, most of their (WSTS & others) total projections are in US Dollars. Stated in US Dollars as well, DMASS grew by 14% in the first nine months of 2018.”
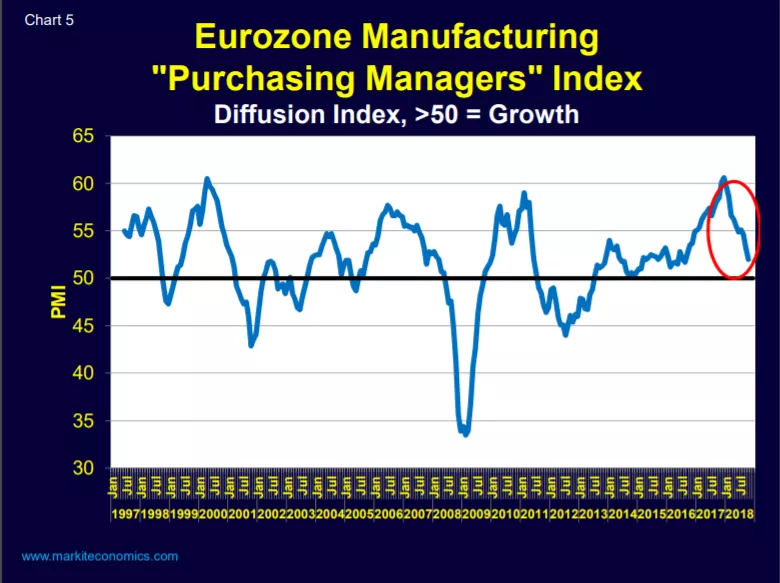
That said, European manufacturing growth has slowed significantly in 2018 based on monthly Purchasing Managers Indices (Chart 5). It is still in positive territory (PMI>50) but has plunged since its December 2017 peak.
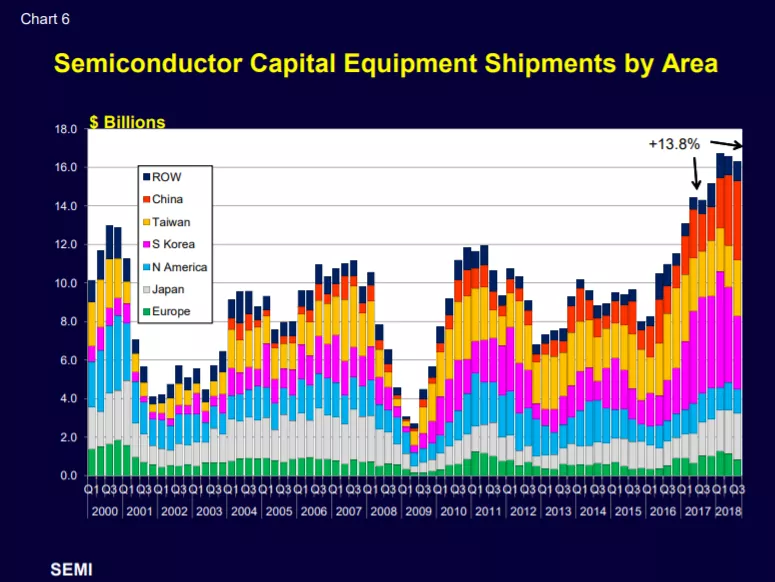
SEMI Equipment
SEMI equipment sales appear to have also peaked globally (Chart 6). Both semiconductors and SEMI equipment were up 13.8% in 3Q’18 vs 3Q’17. The 2017/2018 growth bubble is subsiding and 2019 looks to be a much tamer year.
Interesting times!
Walt Custer of Custer Consulting Group is an analyst focused on the global electronics industry.