
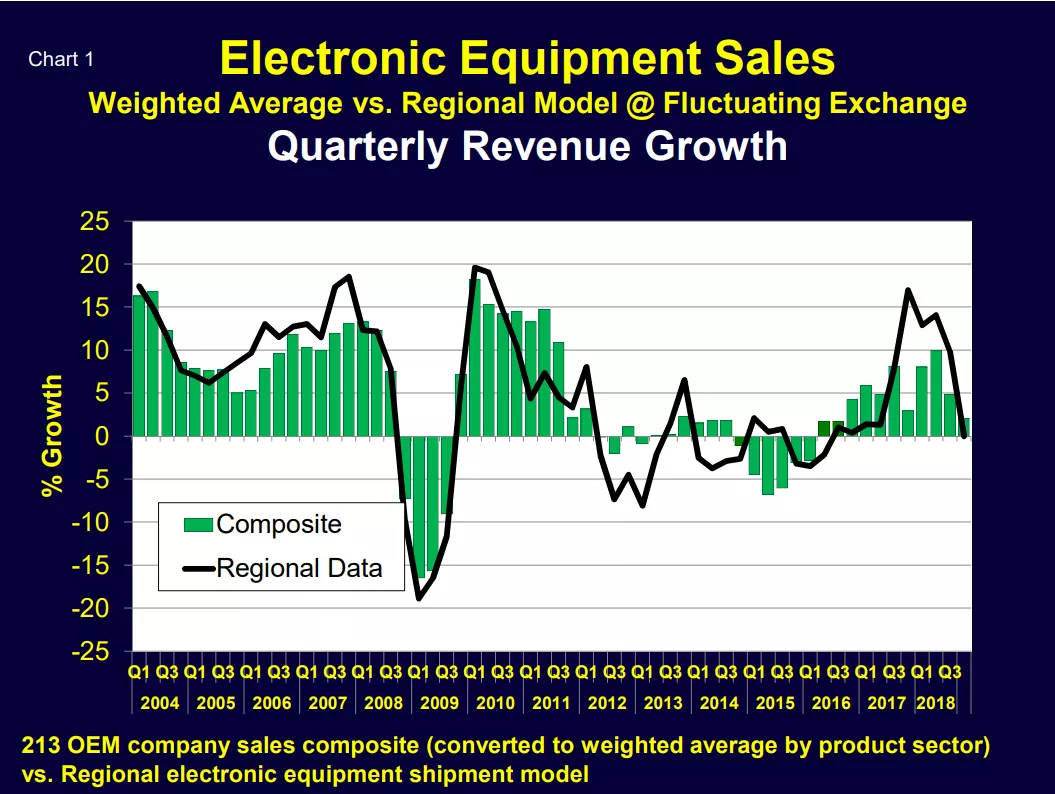
Electronic equipment growth definitely slowed in late 2018 (Chart 1). Based on the consolidated revenues of 213 large, global OEMs electronic equipment sales grew only 2.1 percent in 4Q’18 vs. 4Q’17, down from 4.9 percent in the third quarter and 10 percent in the second quarter.
Reflecting regional data (USA, China/Taiwan, Europe and Japan) rather than the 213 company OEM composite, the fourth-quarter slowdown was even more pronounced, showing 0 percent growth in 4Q’18 vs. 4Q’17.
First Quarter Results
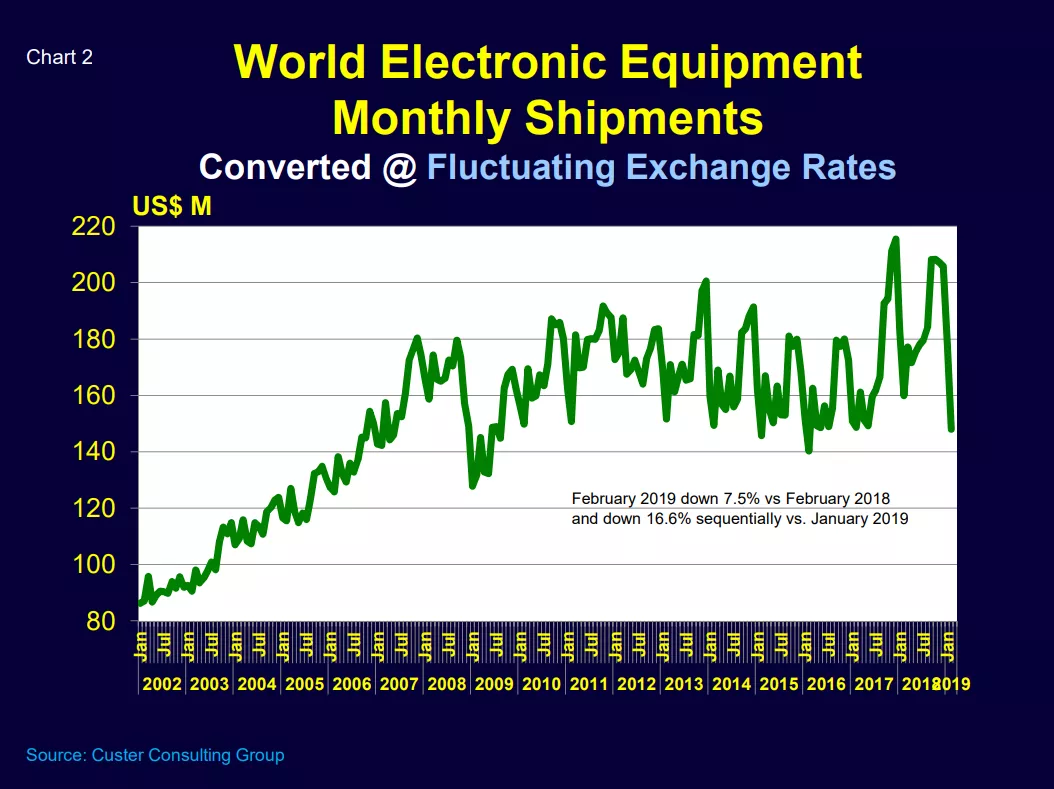
2019 is unfortunately off to a weak start. Due to soft global demand, normal seasonality and February Lunar New Year shutdowns in Southeast Asia, global electronic equipment sales in February 2019 and were down an estimated 7.5 percent versus February 2018 and declined 16.6 percent sequentially compared to January 2019 (Chart 2). March will likely rebound on a monthly basis (normal seasonality) but this year’s weak start is sobering.
Semiconductor Sales Respond
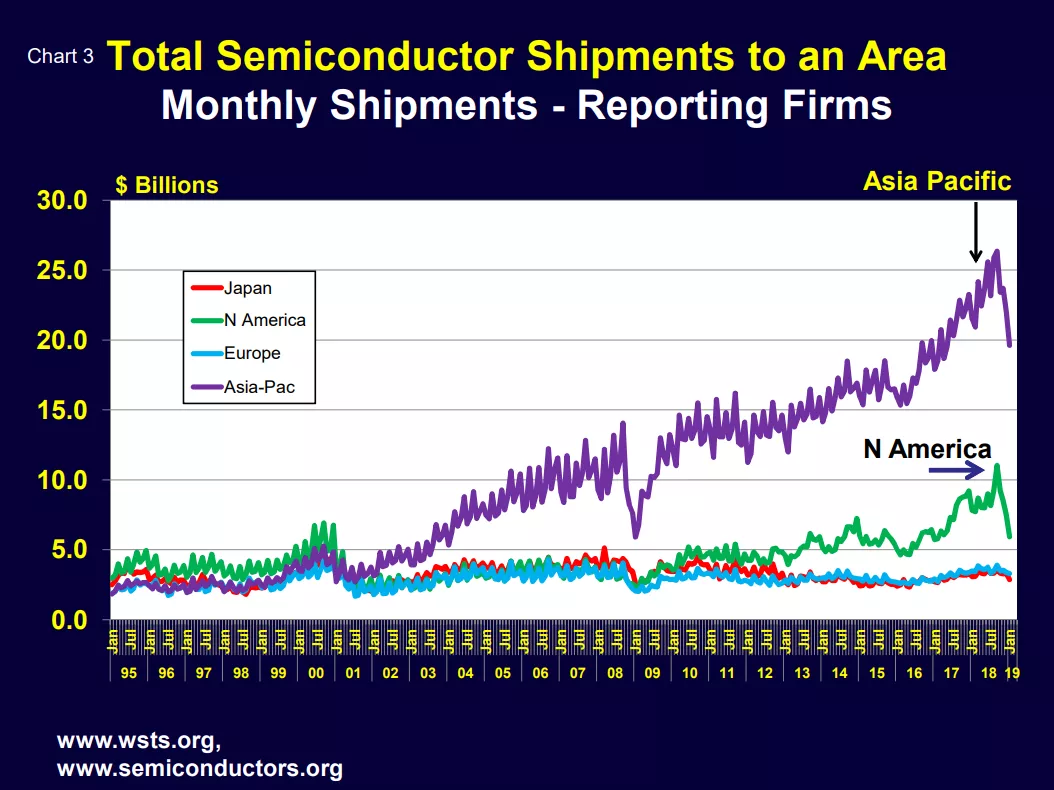
Semiconductor shipments also took an early year dive. Note the especially sharp drop in chip shipments to North America and Asia Pacific in January (Chart 3).
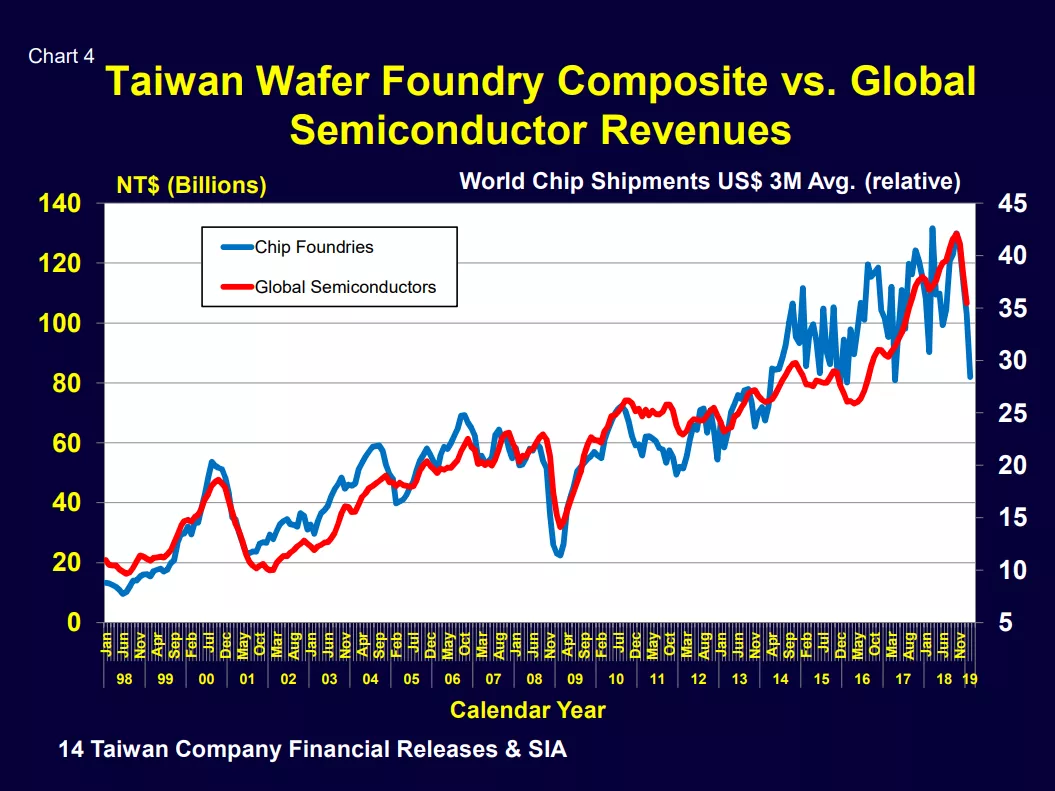
Taiwan wafer foundries gave us a peek at what’s next (Chart 4). Consolidated revenues of 14 Taiwan-listed foundries plunged to a 2-year low. Seasonality, the Lunar New Year, weak demand and some serious raw material problems felt by TSMC all combined to create a large February foundry drop. And since foundry sales have historically been a reliable leading indicator of global semiconductor shipments, we can likely expect further weakness in SIA/WSTS reported chip revenues for February.
Passive Component Shipments Follow Suit
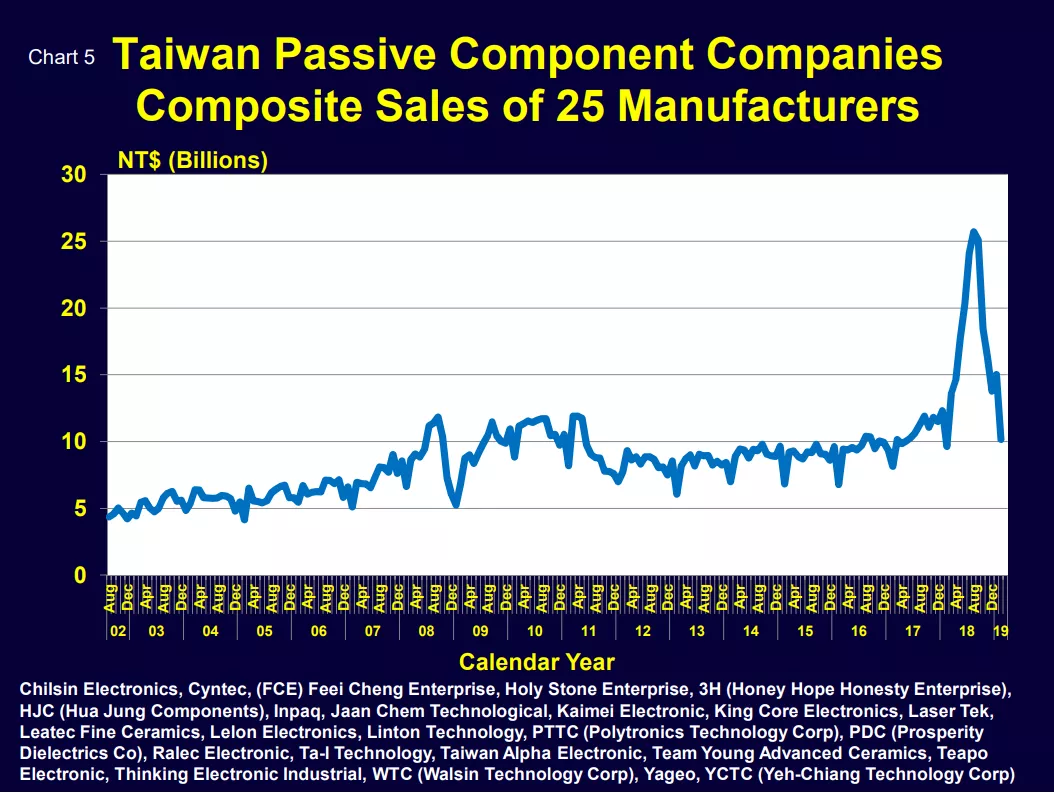
Chart 5 gives the consolidated monthly sales of 25 Taiwan-listed passive component producers, many of which manufacture in China. February hit a seasonal low but the massive plunge from the heights of the 2018 bubble clearly tells the story of shortages, price increases, over ordering and order corrections.
Looking Forward
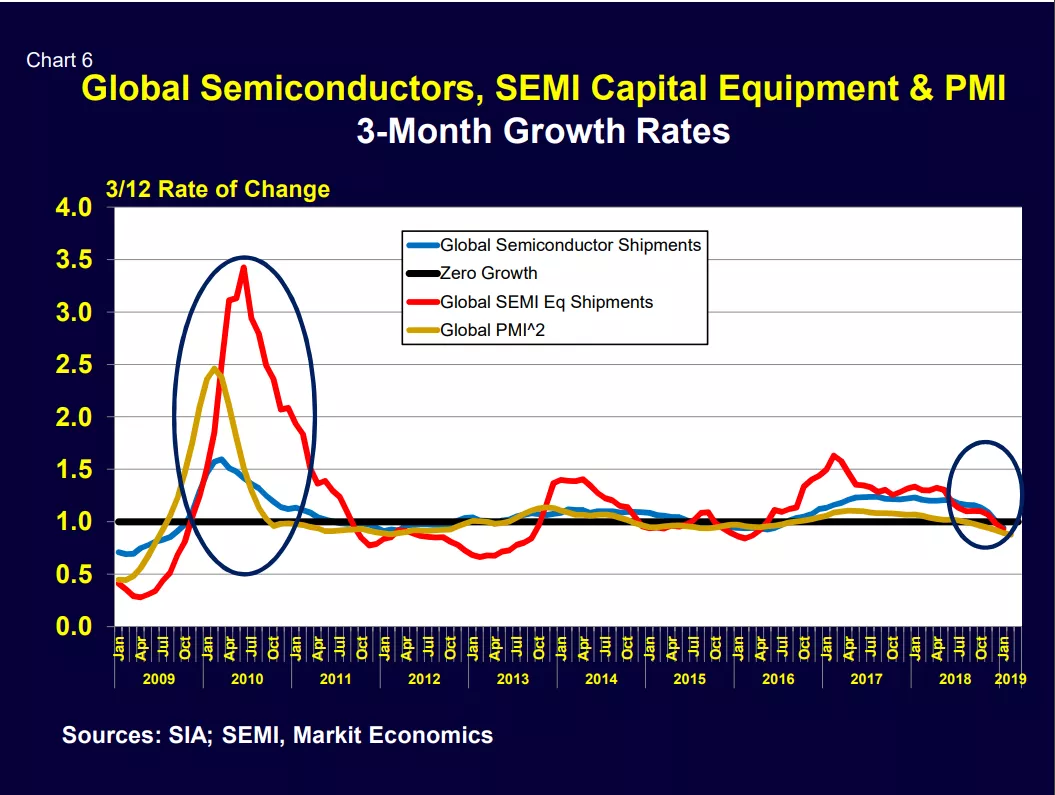
Based on 3/12 global growth data for semiconductors, SEMI equipment and the world PMI leading indicator, it appears that the second quarter will also see weak demand (Chart 6). By 3Q’19 a seasonal pickup should help but 2019 appears to be a year of retrenchment – before 5G and AI hopefully kick start 2020.
Sorry for the not very optimistic short-term outlook. But you were warned. The title said not to look at the charts!
Walt Custer of Custer Consulting Group is an analyst focused on the global electronics industry. He can be reached at walt@custerconsulting.com.