
4Q’18 World Electronic Supply Chain – Slowing Electronic Equipment Growth
Custer Consulting Group has its first estimate of global electronic equipment growth in 4Q’18 vs. 4Q’17. Chart 1 compares the combined sales of a 213-company OEM composite to regional electronic equipment shipments. The composite is based on individual company financial reports. While fourth-quarter results for this group won’t be available until February, the regional model (driven by early reported Taiwan/China results) points to world electronic end market growth declining from +10% in 3Q’18 vs. 3Q’17 to +2% in 4Q’18 vs. 4Q’17.
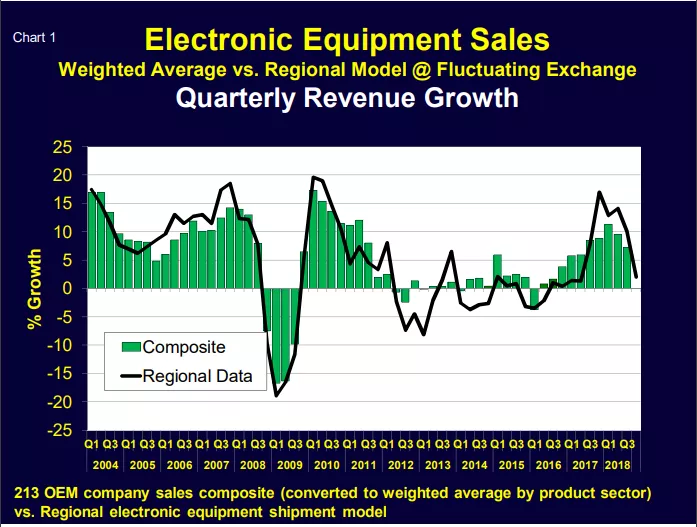
These results are still preliminary, but Chart 1 gives an early indication of the magnitude and trajectory of slowing electronic equipment growth.
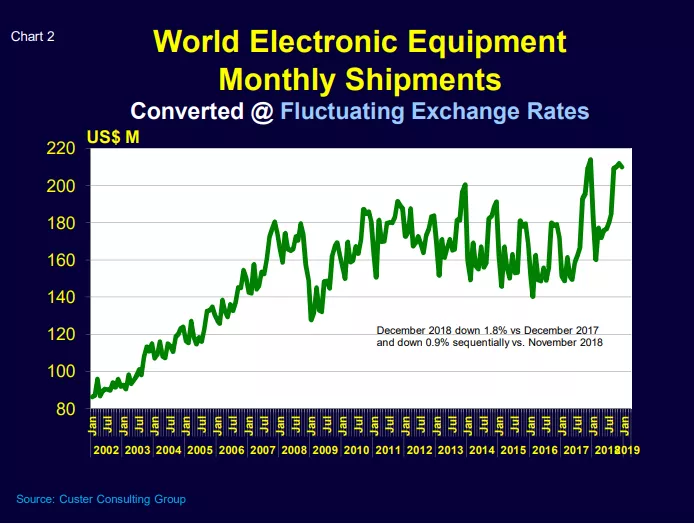
Chart 2 shows consolidated monthly sales from our regional electronic equipment model where December 2018 global revenues declined 1.8% vs. December 2017 and were down 0.9% sequentially vs. November 2018. Note the very predictable seasonality and the apparent “peaking” of 2018 sales in November – with a likely sharp drop in early 2019.
Sources: Company financial reports and USA, Europe, Japan, China/Taiwan and South Korea regional data as analyzed by Custer Consulting Group.
Wafer Foundry Sales – Leading Indicator for Semiconductors and Semiconductor Equipment
December monthly sales have been reported by Taiwan-listed wafer fabs.
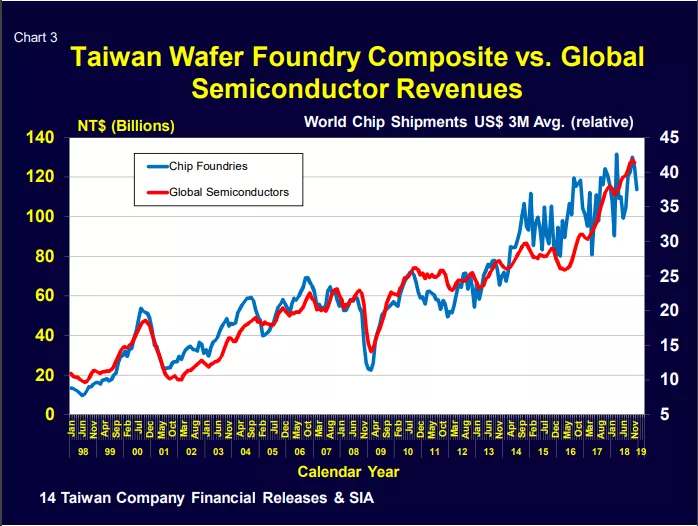
- Wafer foundry revenues dropped in December, suggesting a coming decline in global semiconductor and semiconductor equipment shipments (Chart 3). Foundry sales have historically been a leading indicator for both chips and semiconductor equipment.
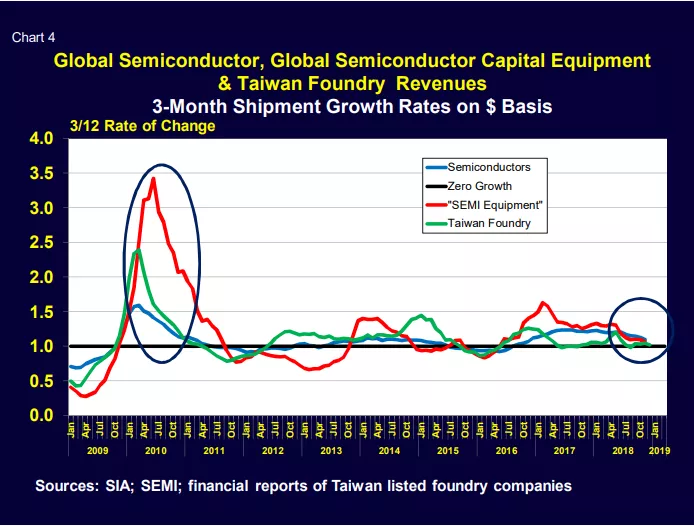
- Taiwan wafer foundry revenues, world semiconductor sales and the Global Purchasing Managers Index 3/12 growth rates all point to further slowing ahead (Chart 4).
Source: Company financial reports
Semiconductor Industry Business Cycles
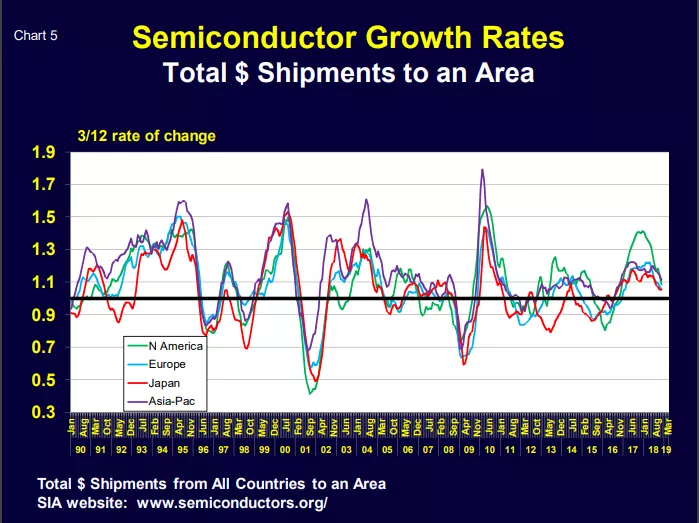
Semiconductor shipment growth (although still positive) peaked in early 2018 (Chart 5). Globally it was up only 4.6% in November 2018 versus the same month a year earlier and its trajectory is pointing down. This compares to +23.7% growth in December 2017.
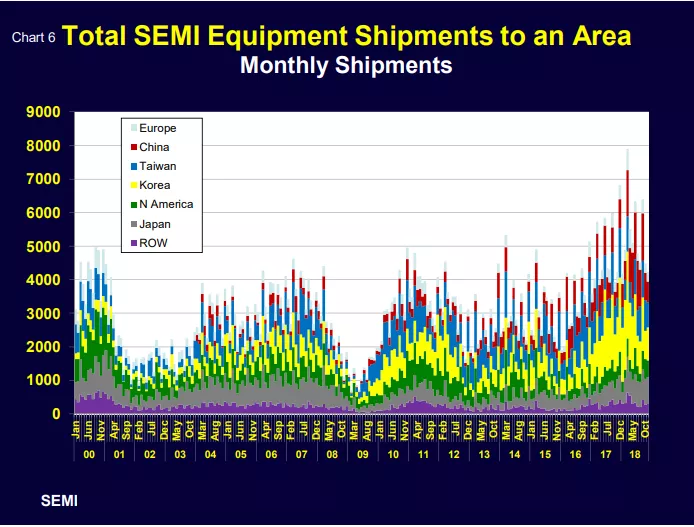
Semiconductor equipment shipments (Chart 6) actually contracted 0.6% globally for just the month of November 2018 vs. November 2017. They are traditionally more volatile than semiconductor sales.
Sources: SIA, WSTS and SEMI
The normal winter seasonal industry slowdown is upon us and it is being overlaid with economic softness, political uncertainty, product (memory) shifts and general industry weakening.
Walt Custer of Custer Consulting Group is an analyst focused on the global electronics industry. He can be reached at walt@custerconsulting.com.