
Global Growth by Electronic Sector
Now that most companies in our sector analyses have reported their calendar third quarter 2018 financial results, we have final or 3Q’18/2Q’17 growth estimates for the world electronic supply chain (Chart 1). We estimate electronic equipment grew 6.7% on a U.S. dollar-denominated basis.
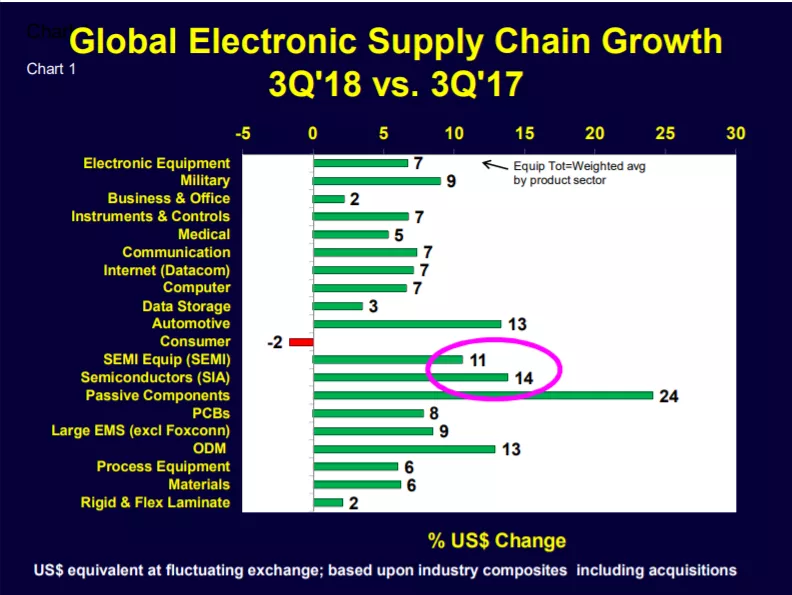
Source: Custer Consulting Group based on consolidated financial reports of public companies
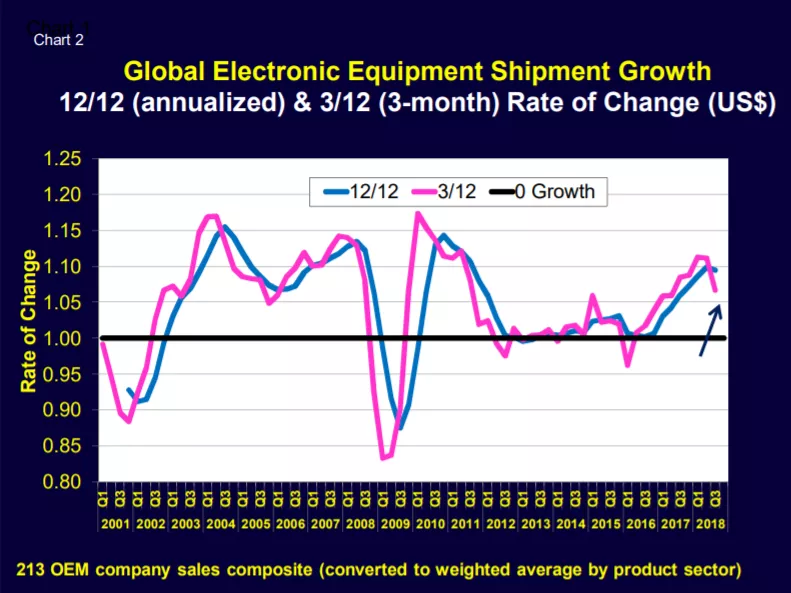
Electronic equipment growth has peaked for this current business cycle (Chart 2), dropping from +11.1% in the second quarter to 6.7% in the third quarter. Most of the supply chain is responding to this slowing.
Semiconductors, SEMI Equipment an Taiwan Chip Foundries
While the most recent growth rates in Charts 1 & 2 are for the third quarter, October and November growth is included in Chart 3. Foundry growth was +4.6% in November, world semiconductor shipments eased to +12.7% in October and SEMI capital equipment slipped to +10% also in October. The days of the +30% growth rates are behind us for this current business cycle!
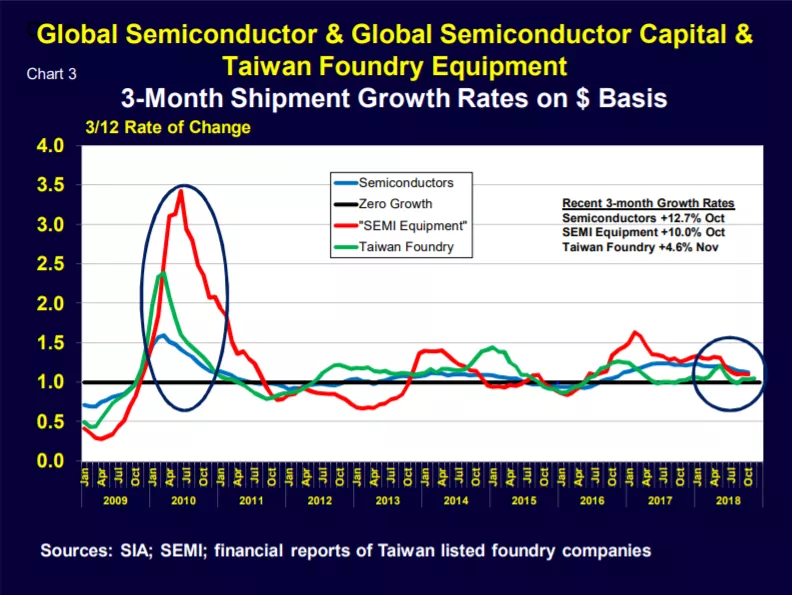
Sources: SIA; SEMI; financial reports of Taiwan listed foundry companies
Global Semiconductor Growth Outlook for 2019
The World Semiconductor Trade Statistics Organization in conjunction with the SIA just updated the chip shipment forecasts for 2018 and 2019 (Chart 4). World semiconductor shipments were estimated to have climbed 15.9% (in U.S. dollars) in 2018 but are predicted to slow to a +2.6% rate in 2019.
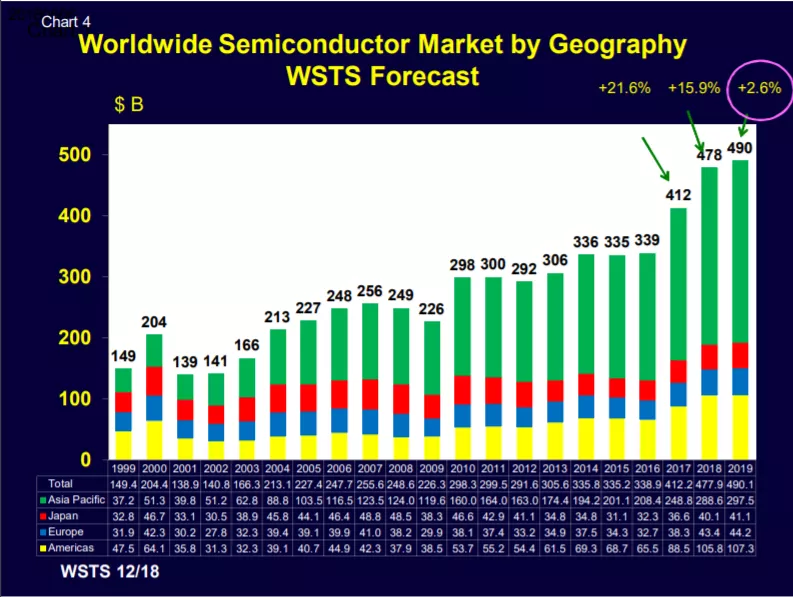
Source: www.wsts.org, www.semiconductors.org
Looking Forward
The Global Manufacturing PMI (Chart 5) leveled out in November but remained well below its December 2017 high. This translates to a slower but still positive world expansion in the short term. By region (Chart 6), U.S. growth remains robust, Japan picked up, Europe continues to decelerate, China is near zero growth and Taiwan and South Korea are contracting.
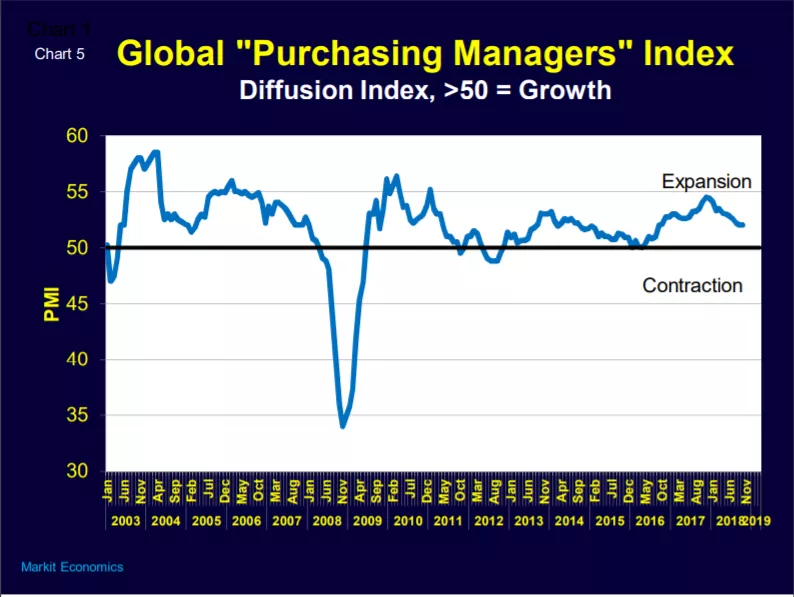
Source: www.markiteconomics.com
All eyes are on the global economy, Brexit, trade wars and bizarre political wrangling. 2019 could be a very volatile year!
Walt Custer of Custer Consulting Group is an analyst focused on the global electronics industry.