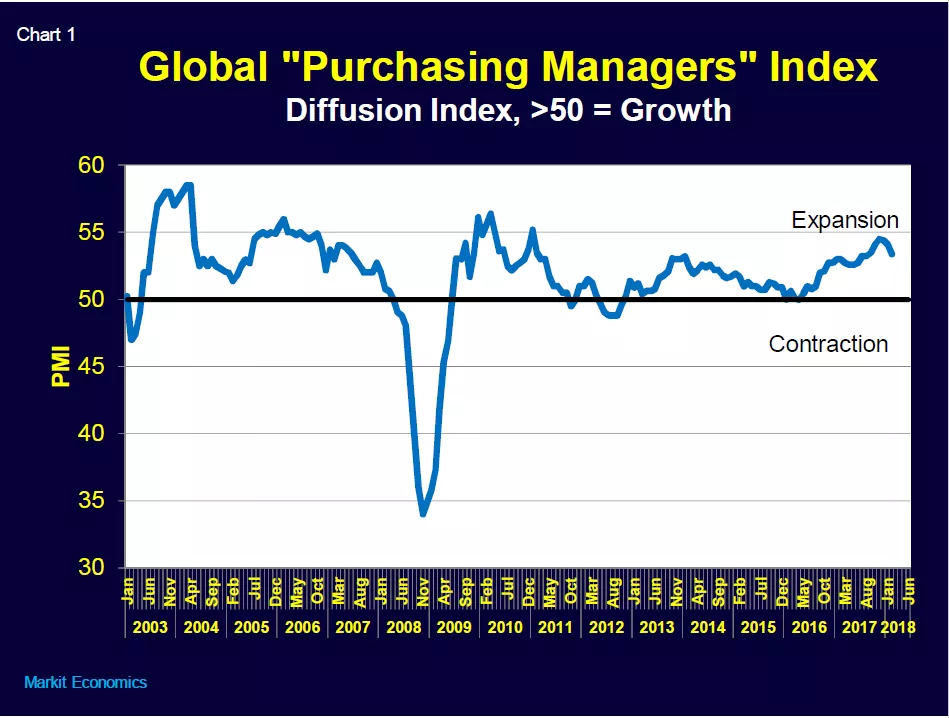
Global Manufacturing Growth has Slowed, but is Still Positive (Chart 1)
Most key countries/regions saw a slowdown in growth in March based on their respective Purchasing Managers Indices. And in one case – South Korea – manufacturing moved into contraction.
| February 2018 | March 2018 | |
| Japan | 54.1 | 53.1 |
| South Korea | 50.3 | 49.1 |
| Taiwan | 56.0 | 55.3 |
| China | 51.6 | 51.0 |
| Europe | 58.6 | 56.6 |
| USA | 60.8 | 59.3 |
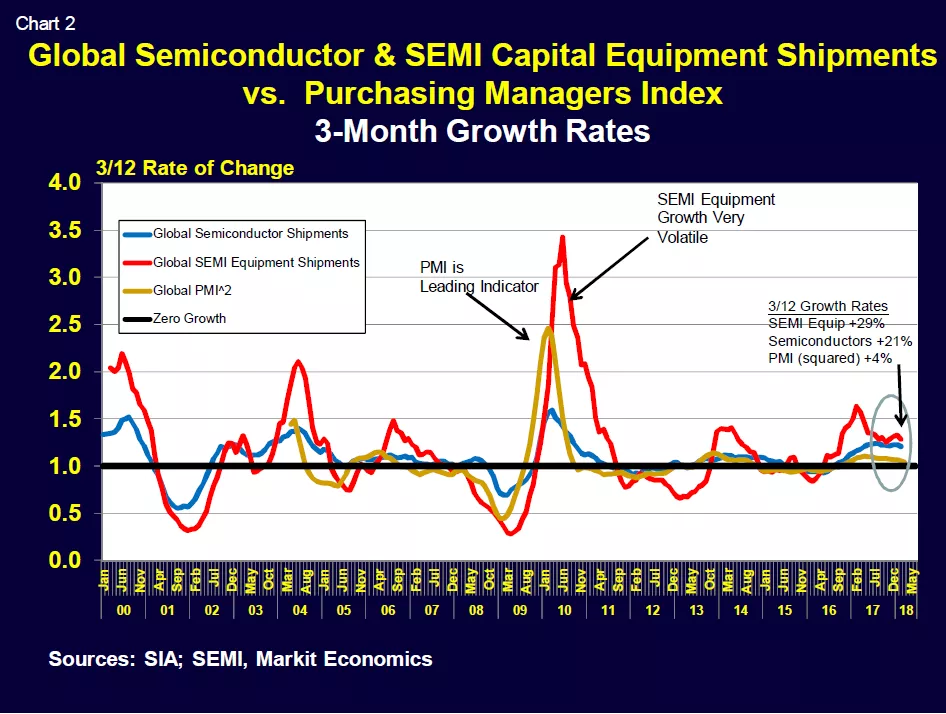
PMI Points to More Modest Expansion (Chart 2)
The global Purchasing Managers Index is a timely and readily available leading indicator for both world semiconductor and semiconductor capital equipment shipments. PMI values greater than 50 indicate expanding manufacturing activity. See www.markiteconomics.com for PMI values for all major countries.
Recent semiconductor equipment, semiconductor and PMI 3-month (3/12) world growth rates were:
| SEMI Equipment | +29% | February |
| Semiconductors | +21% | February |
| PMI (squared) | +4% | March |
The PMI leading indicator now points to more modest but still positive growth ahead.
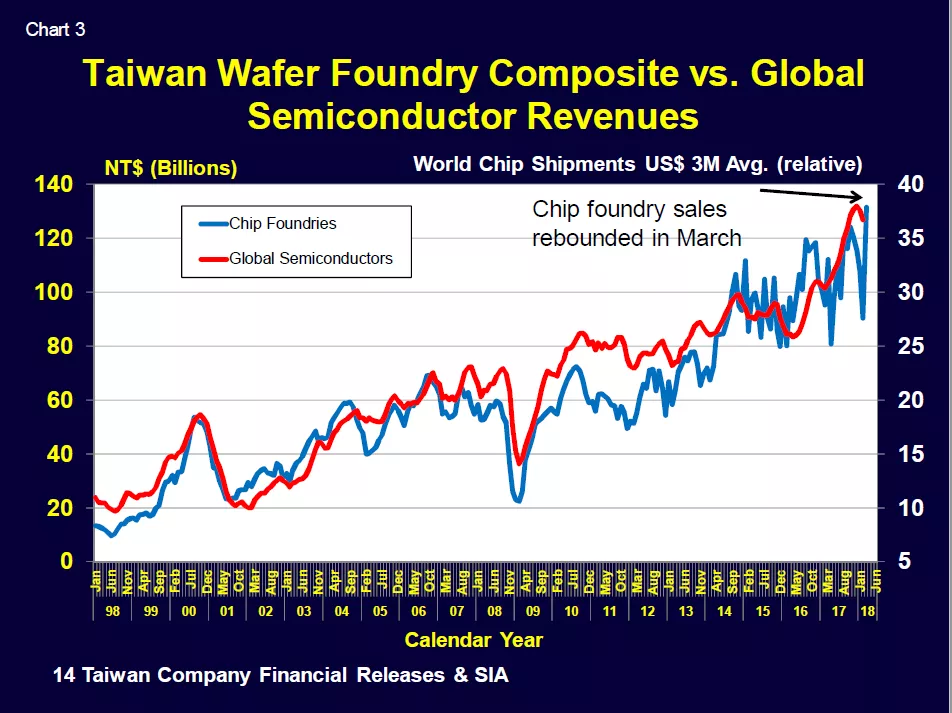
Semiconductor Industry Still has Legs (Chart 3)
Another useful and timely leading indicator is a composite of monthly Taiwan Chip Foundry sales. Taiwan-listed companies publish their revenues about 10 days after the month closes. Chart 3 compares the composite monthly revenues of 14 Taiwan listed foundries vs. global semiconductor sales. Due to Lunar New year shutdowns, February 2018 was weak but foundry sales rebounded in March. Chip demand appears to be holding!
Walt Custer
walt@custerconsulting.com