
Electronic Equipment
Global electronic equipment production is in its traditional “fall busy season” as the consumer driven end markets ramp up for the holiday season (Chart 1). Both normal seasonality and organic growth are driving this year’s upturn. September 2018 electronic equipment output was up almost 10% over the same month last year. This actual year-over-year growth when overlaid on an autumn seasonal upturn is providing a nice end of year finish.
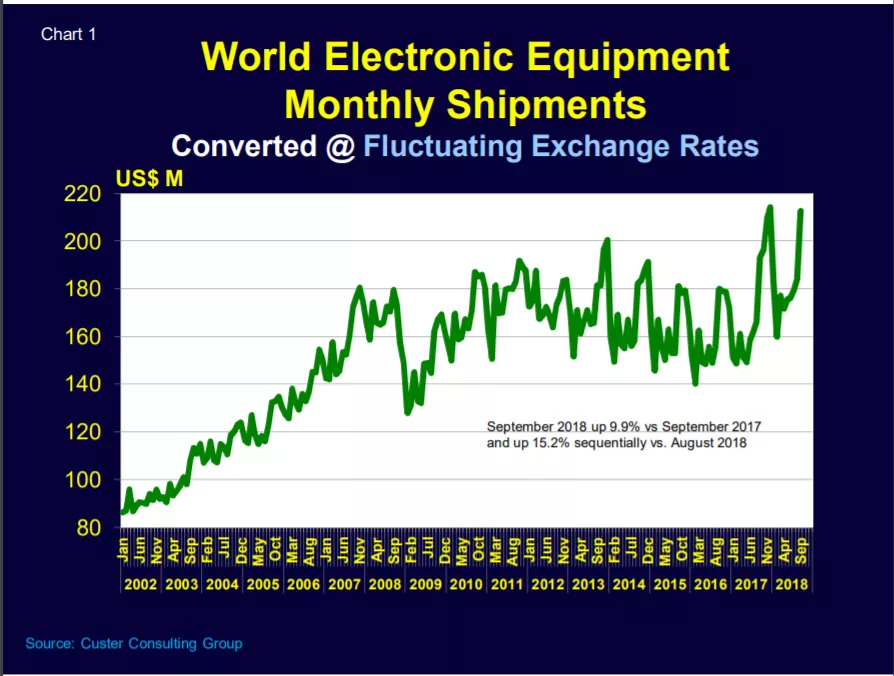
Source: Custer Consulting Group based on regional data
American Electronic Supply Chain
Chart 2 shows the annualized (12/12) and 3-month (3/12) growth of the U.S./North American supply chain. Aside from the computer sector, all the domestic end markets are expanding driven by defense, electromedical, instruments and control equipment. Total domestic electronic equipment orders were up 8.2% in August 2018 versus August 2017.
For components there are clear indications of slowing growth. Printed circuit board orders eased to a +2.7% expansion rate on a 3-month basis and passive component orders contracted 0.2%.
The semiconductor industry appears to be coming down from its recent bubble as domestic SEMI capital equipment growth cooled to +3.8% and chip shipments to North America also slowed (to a still respectable) +15% on a 3-month (3/12) basis.
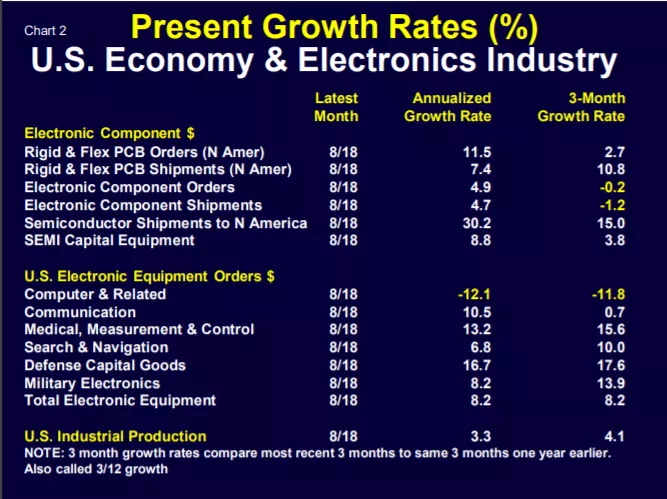
Source: Custer Consulting Group based on U.S. Department of Commerce, IPC, SIA/WSTS and SEMI data
Geographic Shifts
Semiconductors and semiconductor capital equipment shipments provide good insight into the changing center of gravity of world electronic production.
Chart 3 shows semiconductor shipments to each region. This is not regional production but rather consumption -- an indication of regional demand. It effectively measures electronic assembly activity by area. In August over 62% of the world’s chip value was consumed in in Asia/Pacific with another 8.1% used in Japan. Europe consumed 8.5% and North America 21.9%.
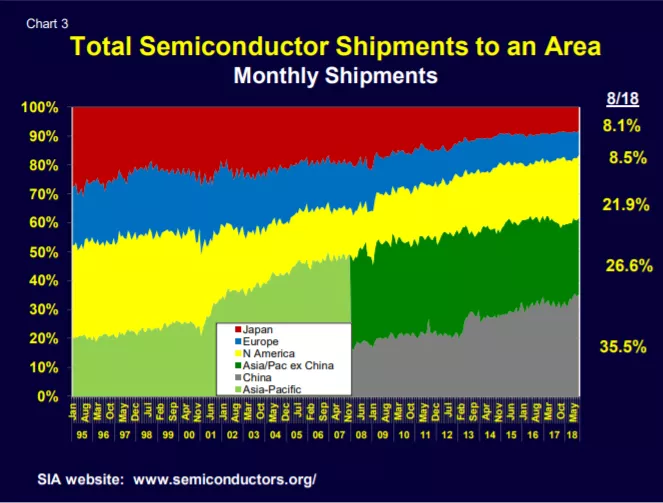
Chart 4 shows geographical shifts over time for semiconductor capital equipment. Although more volatile month-to-month than semiconductors, the SEMI Capex shift to Asia is obvious.
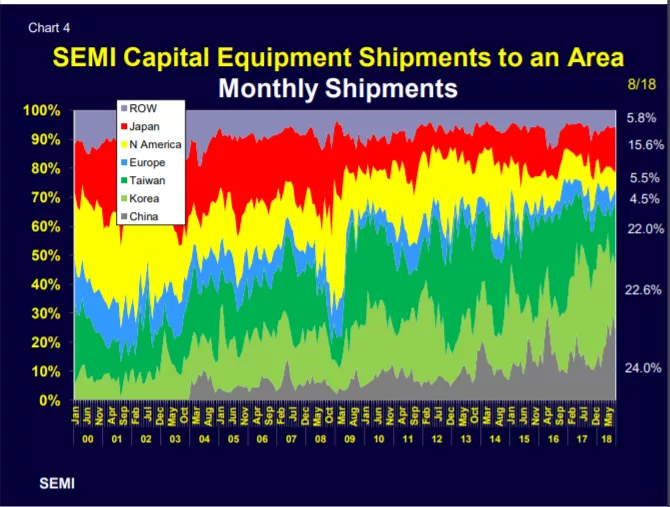
Source: SIA and WSTS
Walt Custer of Custer Consulting Group is an analyst focused on the global electronics industry.