Micron, one of the top three memory semiconductor companies, reported solid results for the fourth quarter of fiscal 2018 (June to August) to extend a multi-quarter string of strong growth. However, the company’s mediocre guidance for the current quarter has raised concerns that memory demand will start to slow.
To shed light on this super memory cycle, which began in the second half of 2016, this article examines correlations among the top three memory suppliers’ sales revenue, quarterly inventory levels, World Semiconductor Trade Statistics (WSTS) market data, and memory fab equipment investments reported by SEMI.
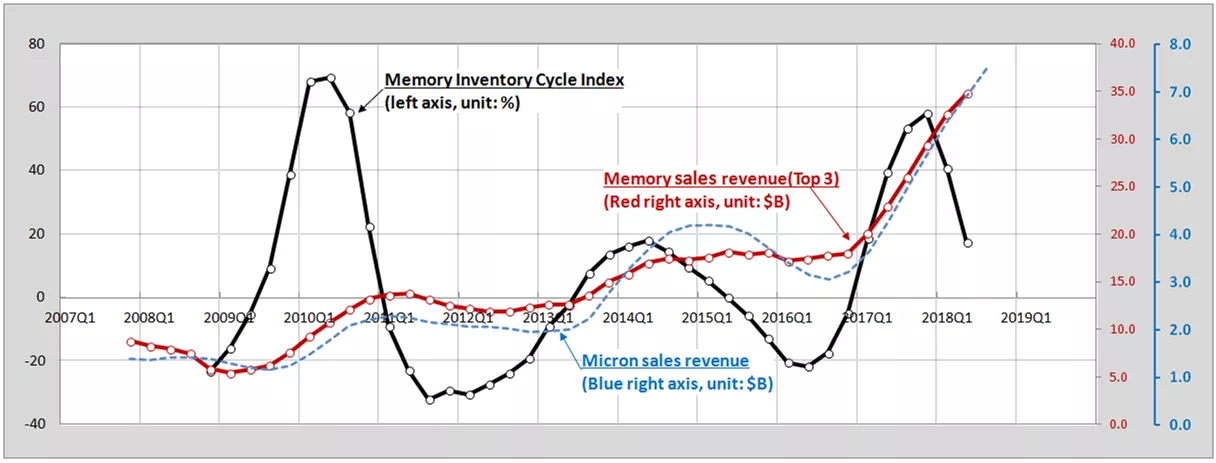
The Memory Inventory Cycle Index, which is based on financial data reported by Samsung, SK Hynix and Micron, is the difference between the year-over-year growth rates of sales (or shipments) and inventories. The index explains business cycle fluctuations such as expansions and contractions, trending up in expansions and declining in contractions. Figure 1 shows both historical Micron sales (blue dotted line) and the quarterly Memory Inventory Cycle Index (black solid line). To minimize seasonal fluctuations, both were calculated based on a four-quarter moving average of sales and inventories.
Figure 1. Memory Inventory Cycle Index Compared to Memory Sales

* Remarks
1) Memory Inventory Cycle Index = YoY growth rate of memory sales revenues - YoY growth rate of memory total inventoris value on a four quarters moving average.
2) Calculated memory sales and inventoris are based on Samsung, SK Hynix, and Micron public announcements.
3) South Korea Won were converted to US$ based on the quaterly average value released by FRED.
4) Companies’ sales data were calculated based on 4-quarter moving average.
5) Company data complied by SEMI.
As shown in Figure 1, the Memory Inventory Cycle Index has been declining since peaking in the fourth quarter of 2017, mirroring the previous two contractions – in 2010 and 2014 – in which memory sales slowed or stagnated after four quarters of the index decline. Accordingly, if this relationship holds between the Memory Inventory Cycle Index and sales, Micron’s sales will slow in the coming quarters and is consistent with Micron’s guidance for the current quarter. Moreover, the index suggests that the sum of three companies’ sales (the solid red line) will exhibit a similar trend of decreased growth in the coming quarters, which will impact the annual growth rate of global memory sales.
WSTS recently increased its 2018 forecast for memory sales to 30.5%, up from 26.5% projected in June of this year. However, the 3-month moving average of memory sales shows that memory sales already increased by 48% YoY in the first half of the year, which means growth is expected to be lower in the second half of the year. Other signs pointing to a weaker end to the year include front-end equipment investments by the top three memory suppliers. SEMI is modeling an annual increase of only one percent for the year for these suppliers, with spending down 23% in the second half relative to the first half of the year.
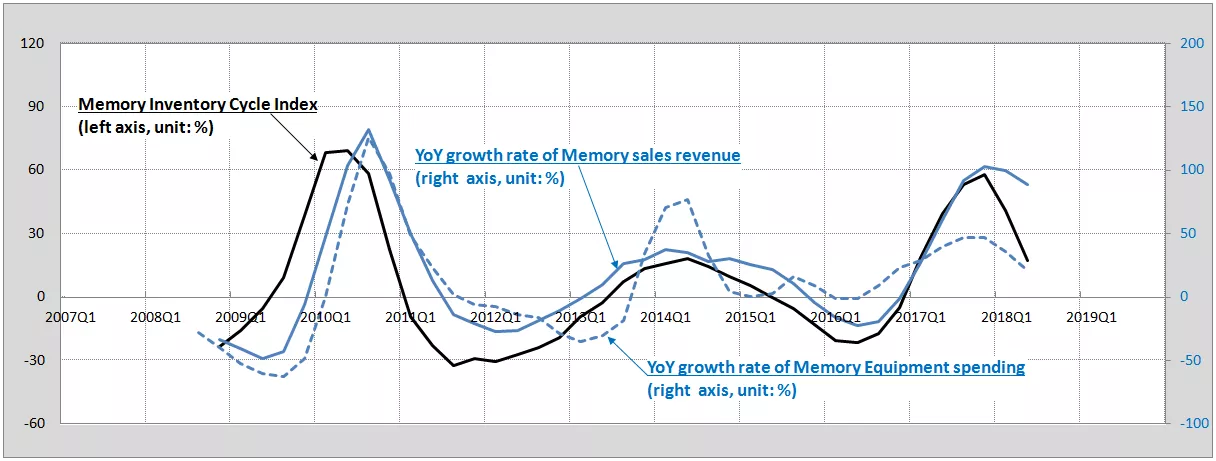
Figure 2 shows the historical trend of the Memory Inventory Cycle Index, the YoY growth rate of memory sales, and YoY memory fab equipment investments. The Memory Inventory Cycle Index increased faster than memory sales and fab equipment investments in the past two cycles. In the most recent memory cycle, these three indexes are moving in tandem, each peaking in the fourth quarter of 2017.
Figure 2. Memory Inventory Cycle Index, Memory Sales and Memory Fab Equipment Investments

* Remarks
1) Both sales and memory fab equipment investments data were calculated based on 4-quarter moving average to minimize seasonal fluctuation.
2) All data are from SEMI, except memory sales (WSTS)
While overall memory sales continue to be strong this year, memory ASPs have shown signs of weakening right after the inventory index peak. NAND flash ASPs have been trending downward since the first quarter of 2018. With the recent inventory correction and short-term CPU shortage, DRAM ASPs are expected to soften in the fourth quarter of 2018. The looming memory market slowdown has memory makers adjusting their capacity expansion plans for the rest of this year. Some new capacity additions, especially for DRAM, have been pushed out to 2019. The memory inventory cycle index has to some extent foretold the slowdown of the memory market.
In the second and final part of this article, we will discuss the correlation between the Memory Inventory Cycle Index and China’s semiconductor sales and Purchasing Managers Index. We will also look at the increasing level of memory inventory in the past few quarters and its composition including Work-in-Progress and Finished goods.
Clark Tseng is director and Sungho Yoon is senior market research analyst in Industry Research and Statistics at SEMI.
SEMI World Fab Forecast
For the latest worldwide memory fabs forecast including company details, please see the SEMI World Fab Forecast. The report includes quarter-to-quarter fab data from planning to production for both DRAM and NAND Flash companies.