
Global Manufacturing Activity
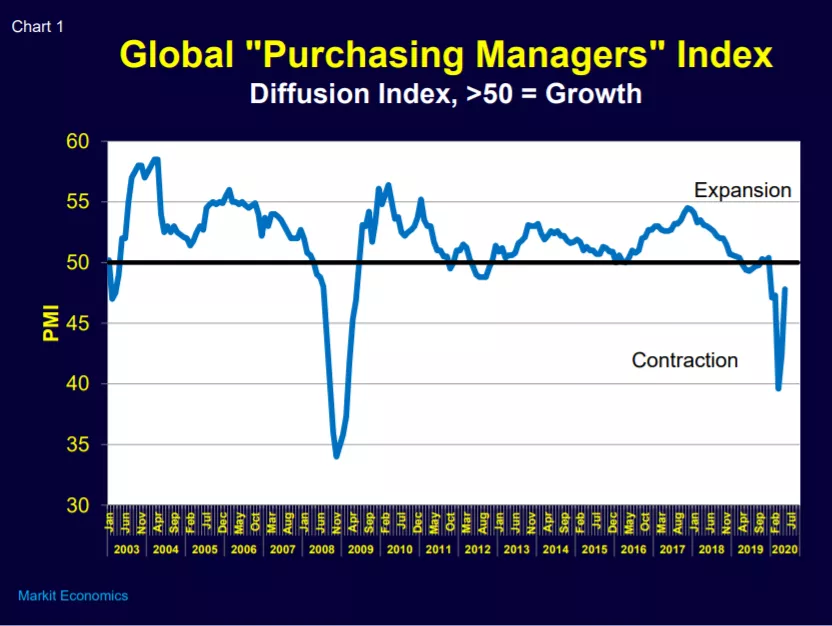
World manufacturing activity declined less in June compared to May based on the June Global Purchasing Managers Index. Per Chart 1, the Global PMI rose to 47.8 in June, up from 42.4 in May.
Keeping in mind that the crossover line between manufacturing expansion and contraction is PMI=50, the June PMI of 47.8 indicates that global manufacturing activity was still contracting, but at a slower rate of decline.
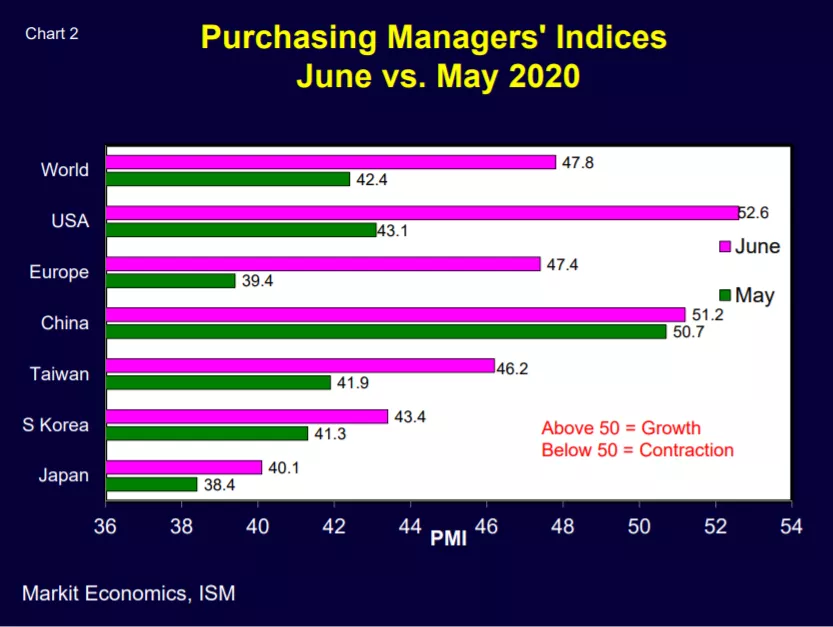
Results varied regionally, but all the major countries in Chart 2 reported PMI improvements in June.
Worldwide Electronic Equipment Sales
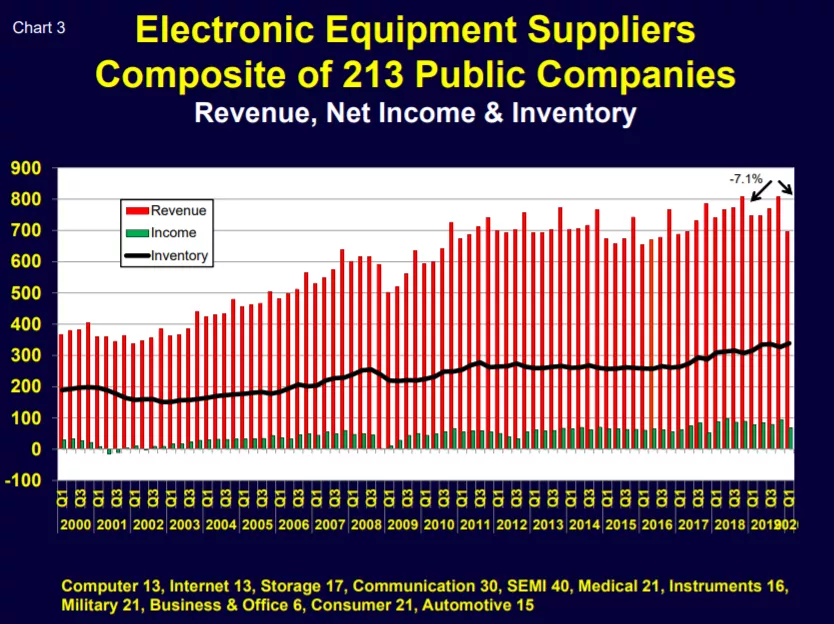
Electronic equipment sales declined globally in the first quarter, down 7.1% in 1Q’20 vs. 1Q’19 (Chart 3). This estimate is based on first-quarter financial reports of 213 publicly traded electronic equipment companies worldwide.
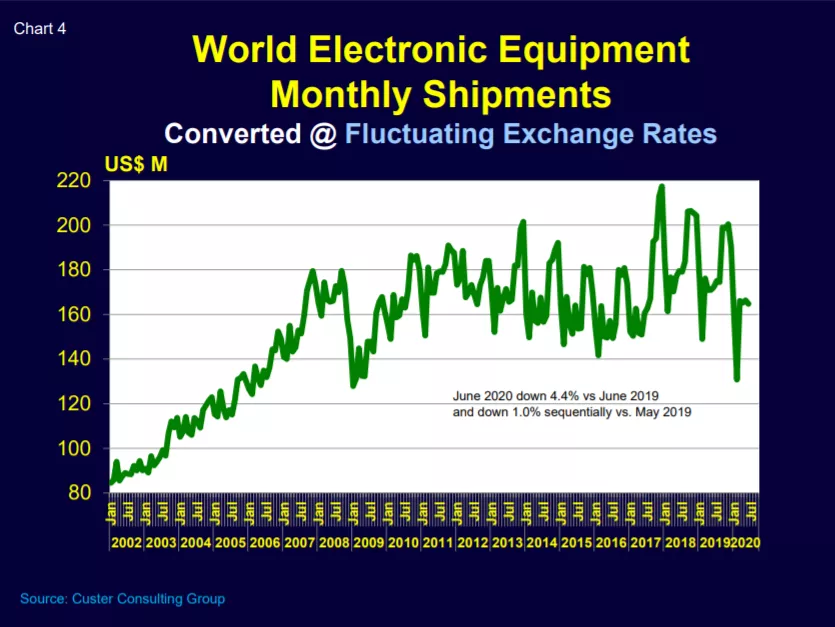
Additional (and timelier) information based on consolidated regional data indicates that June 2020 electronic equipment sales were down 4.4% vs. June 2019 and down 1.0% sequentially vs. May 2020 (Chart 4).
U.S. Electronic Supply Chain Growth
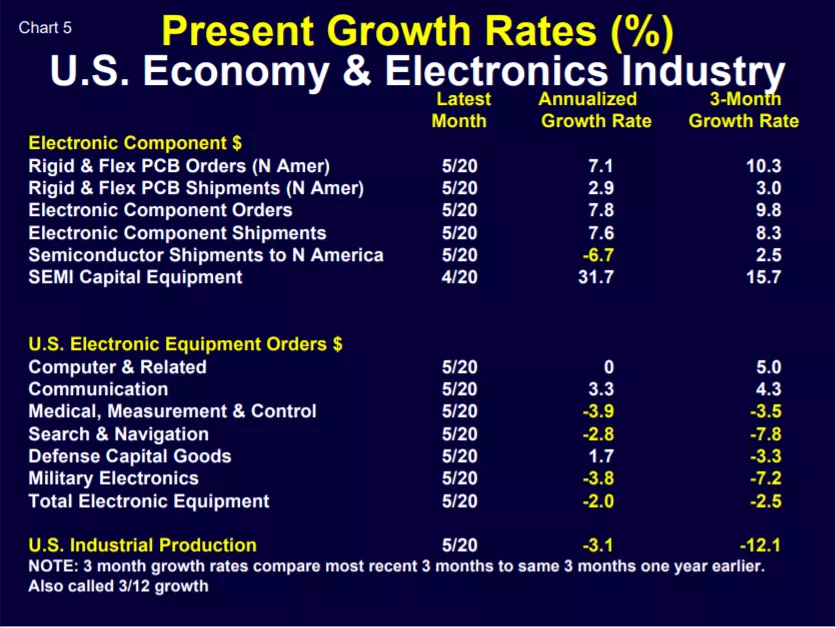
The United States is feeling the pain of the COVID-19 pandemic and its resulting economic recession. Based on May 2020 Department of Commerce data, most of the domestic electronic equipment sectors saw decreases in their 3-month order growth rates in May (Chart 5).
Electronic Equipment Product Mix Changes
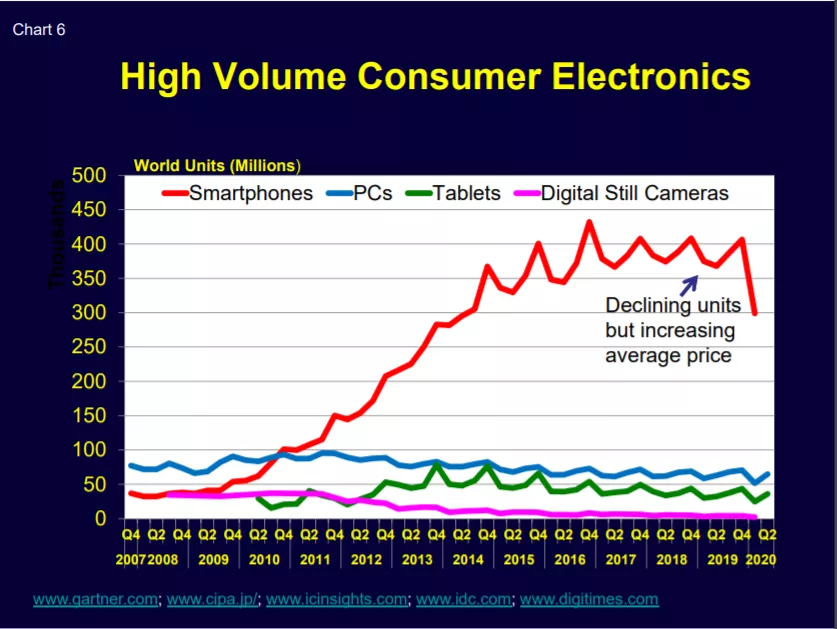
The product mix of world electronic equipment sales has recently changed for consumer-driven purchases – personal computers, smart phones, media tablets and digital cameras. Per Chart 6, smartphone sales dropped in the first two quarters of this year due to both normal seasonality and the pandemic and it’s resulting negative economic effects.
However, PCs and media tablets saw sales increases in 2Q’20 to support people working at home and children studying online.
Digital camera demand has taken an ongoing hit as ever-improving smartphones have replaced lower end point-and-shoot cameras for casual photography.
The 2Q’20 PC and tablet sales increase is likely temporary, but the digital camera decline is ongoing and threatening the economic viability of major camera producers.
Semiconductor Industry Outlook
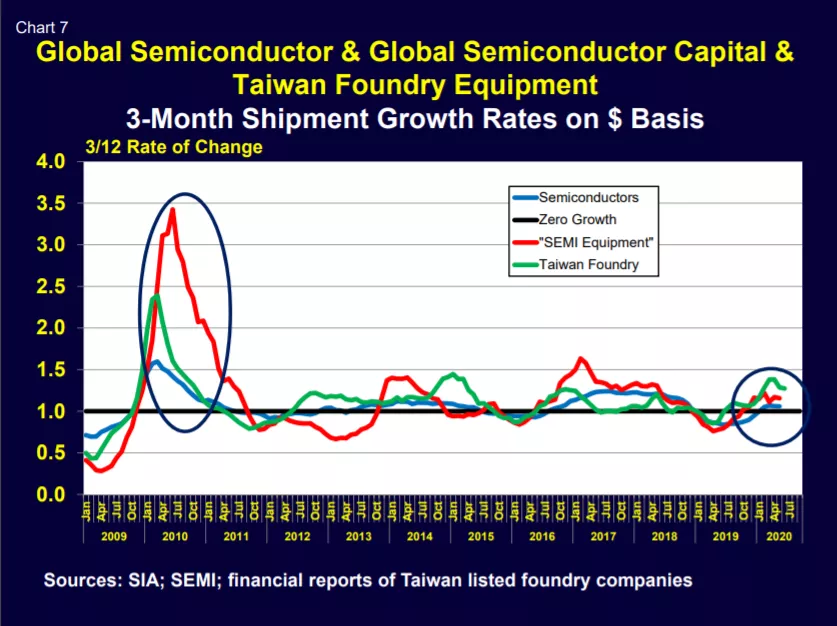
Foundry sales have historically been a leading indicator of world semiconductor shipments. Per Chart 7, semiconductors, SEMI capital equipment and foundry sales are all growing (3/12>1) but their growth rates have slowed. However, there are encouraging signs.
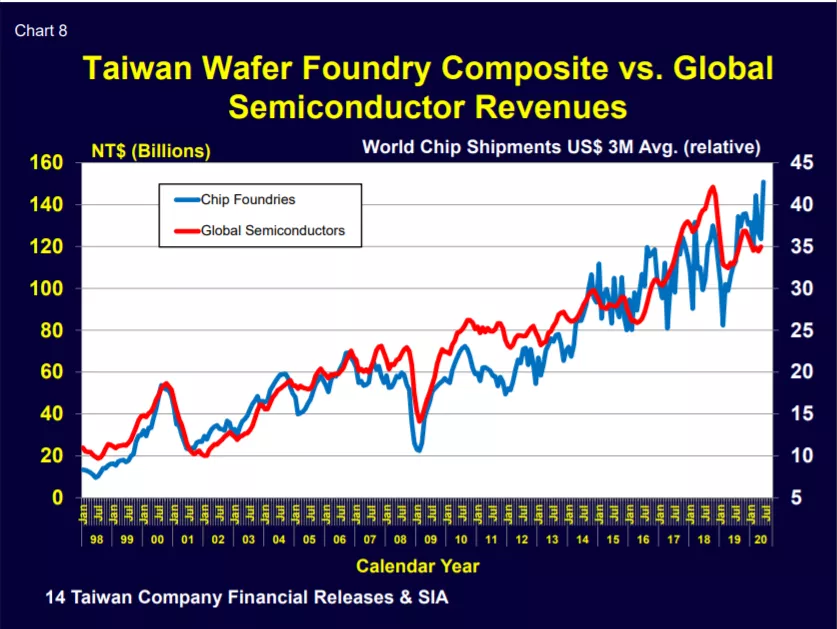
Per Chart 8, Taiwan-listed wafer foundry sales jumped in June, suggesting somewhat better times ahead for semiconductor chip and chip equipment companies.
Final Thoughts
2020 still looks to be a very difficult year. How we manage the pandemic, the global economy and international relations remain major challenges but there are glimmers of light near-term and a likely much brighter future in 2021 and 2022.
Walt Custer of Custer Consulting Group is an analyst focused on the global electronics industry.