The silicon wafer market got off to a rough start in 2019 with major silicon wafer manufacturers’ sales weakening in the first quarter of the year following a sharper memory market downturn than expected. Earnings forecasts for the rest of the year have been revised down, reflecting deteriorating market conditions relative to the first half of the year. In August, SUMCO's third quarter sales guidance fell by 13.7% year-over-year and, in June, Siltronic revised down its full-year sales guidance to 10% to 15% year-over-year, lower than its guidance in May.
What’s more, total silicon wafer area shipments during the first half of 2019 declined by 3.3% relative to the first half of 2018. Even though Shin-Etsu and GlobalWafers posted better-than-expected 2Q19 results, concerns are growing that the silicon wafer market is slowing after five years of record volume shipments and improving profits, as shown in Figure 1.
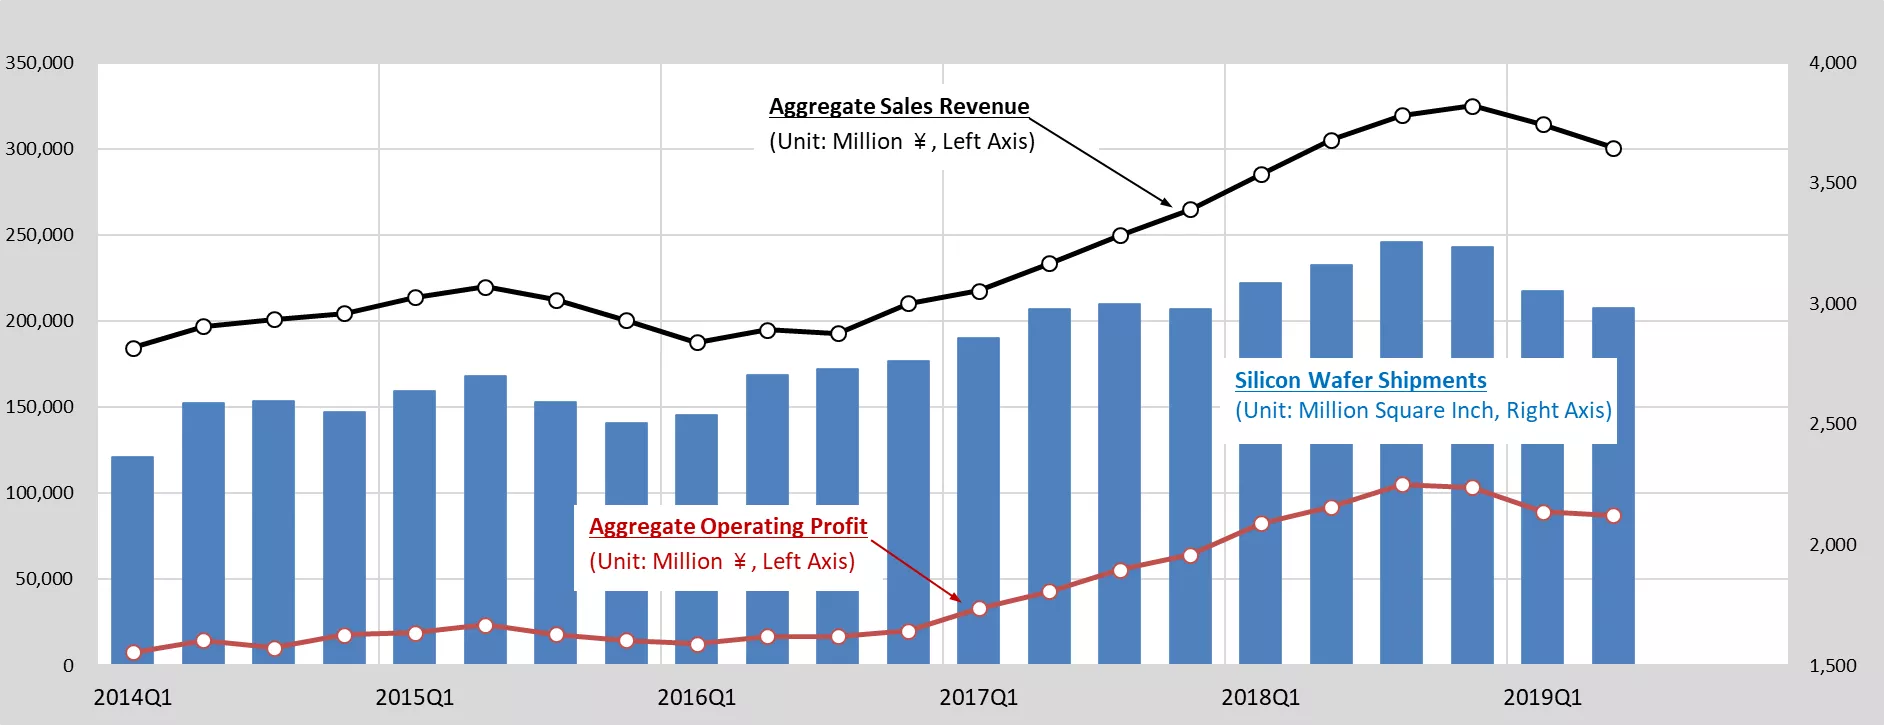
The graph below shows total silicon wafer area shipments, quarterly aggregate sales revenue and operating profit of the top five wafer companies – Shin-Etsu, SUMCO, Siltronic, Globalwafers, and SK Siltron. As of the second quarter of 2019, total silicon wafer area shipments experienced three consecutive quarterly declines to reach levels not seen since the second quarter of 2017. As the graph indicates, both aggregate sales revenue and operating profit dropped.
Figure 1 - Quarterly Silicon Shipments compared to Aggregate Sales Revenue and Profit
Remarks
- Data source: SEMI Silicon Shipments Statistics and Each Company’s Financial Data
- All currency exchange rates were calculated on the basis of quarterly average value released by FRED
- SunEdison Semiconductor is included in the aggregate sales and operating profit prior to 2017
Against this backdrop, the timing of investments by silicon wafer manufacturers and chipmakers has diverged since the 2008 financial crisis. Wafer companies have remained hesitant to expand silicon manufacturing facilities without first securing commitments by chipmakers to fund additional silicon capacity, a reluctance that has caused wafer inventory levels to fall short of chipmakers’ expectations. As demand began to outstrip supply, wafer manufacturers were forced to invest to meet immediate silicon demand and commit expenditures to cover long-term contract volumes in 2019 and 2020.
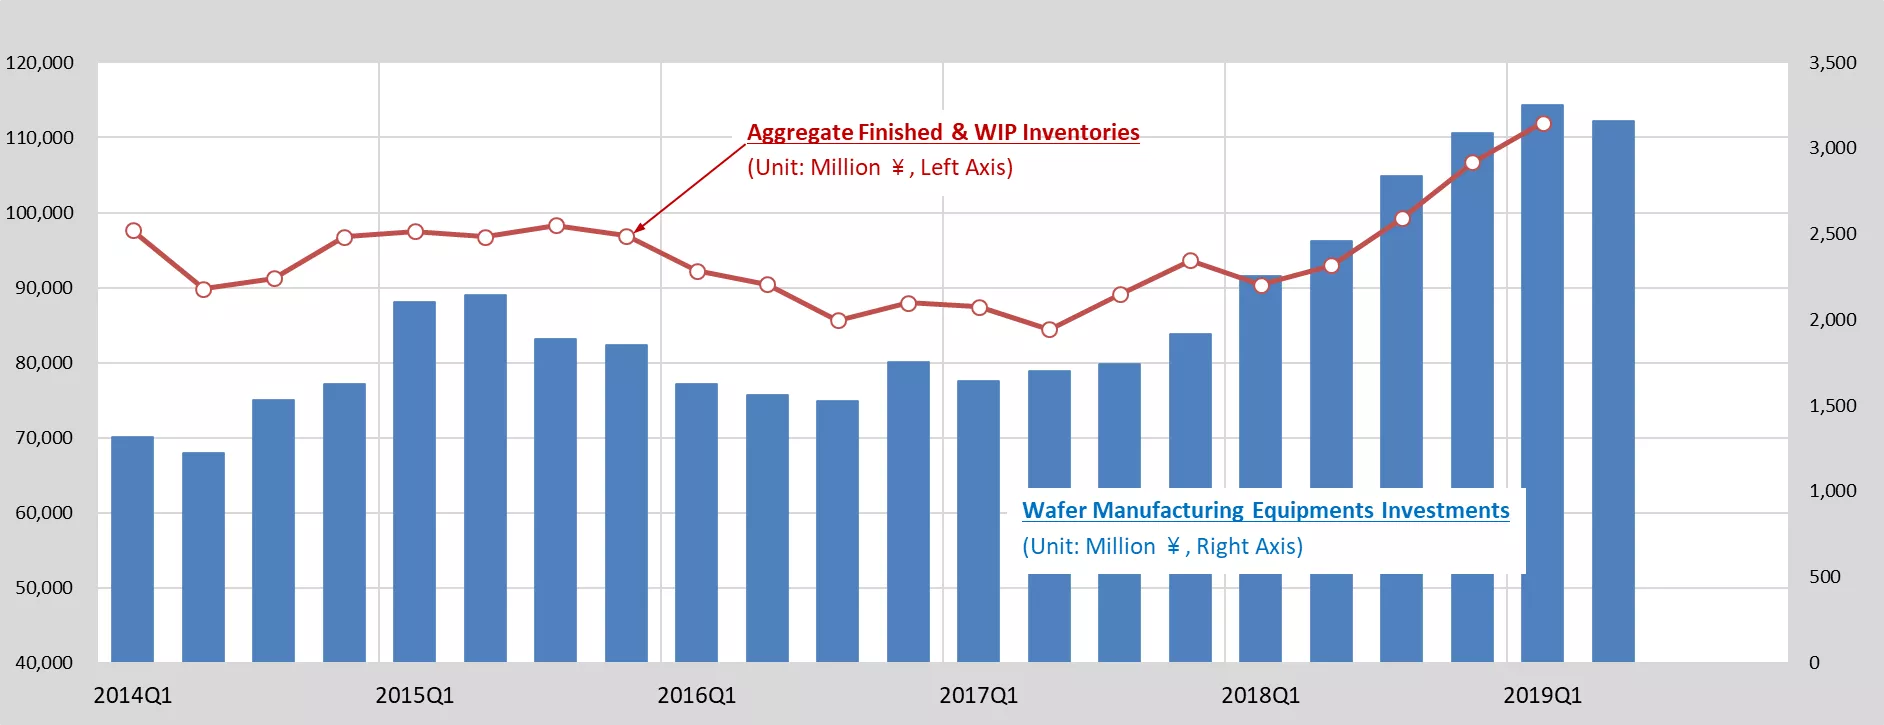
Figure 2 compares quarterly wafer manufacturing equipment investments to aggregate finished and work in progress (WIP) inventories for the past two years. Inventories, which include finished goods and WIP inventory excluding raw materials such as polysilicon, bottomed out in the second quarter of 2017 and then increased in lockstep with wafer manufacturing investments. In the first quarter of this year, quarterly aggregate sales declined while inventories continued to rise.
“Of the increase in inventories of products, the increase in wafer inventories accounted for approximately 50%,” Shin-Etsu said in its April earnings release.
Figure 2 - Quarterly Wafer Manufacturing Equipment Investments Compared to Aggregate Finished and WIP Inventories
Remarks
- Data source: SEMI WWSEMS and Each Company’s Financial Data
- Inventories include only Finished Goods and WIP sector, Not Raw materials
- Inventories of companies which do not release inventories details were assumed based on their financials and industry data
- Wafer Manufacturing equipment investments by SEMI WWSEMS was calculated based on 4-quarters moving average value
- All currency exchange rates were calculated on the basis of quarterly average value released by FRED
Overall, the wafer market favors buyers, with wafer manufacturers unable to enforce long-term contracts because of oversupply. As a result, wafer companies have opted to reduce contract volumes this year to maintain contract prices, as SUMCO commented in its first quarter 2019 earnings.
Earlier this year, when the consensus was that the memory market would rebound in the second half of 2019, the strategy to maintain prices instead of volume was sound. However, confidence in the second half rebound has faded, and the recovery is now expected in 2020. The memory segment, in particular, has not bottomed yet. Micron’s recent announcement that it would reduce utilization in fiscal year 2019 and capital expenditures (CAPEX) in fiscal year 2020 reflects difficult market conditions. SK Hynix will also cut production and investment in the coming quarters. In short, the wafer market remains challenging for suppliers the rest of this year.
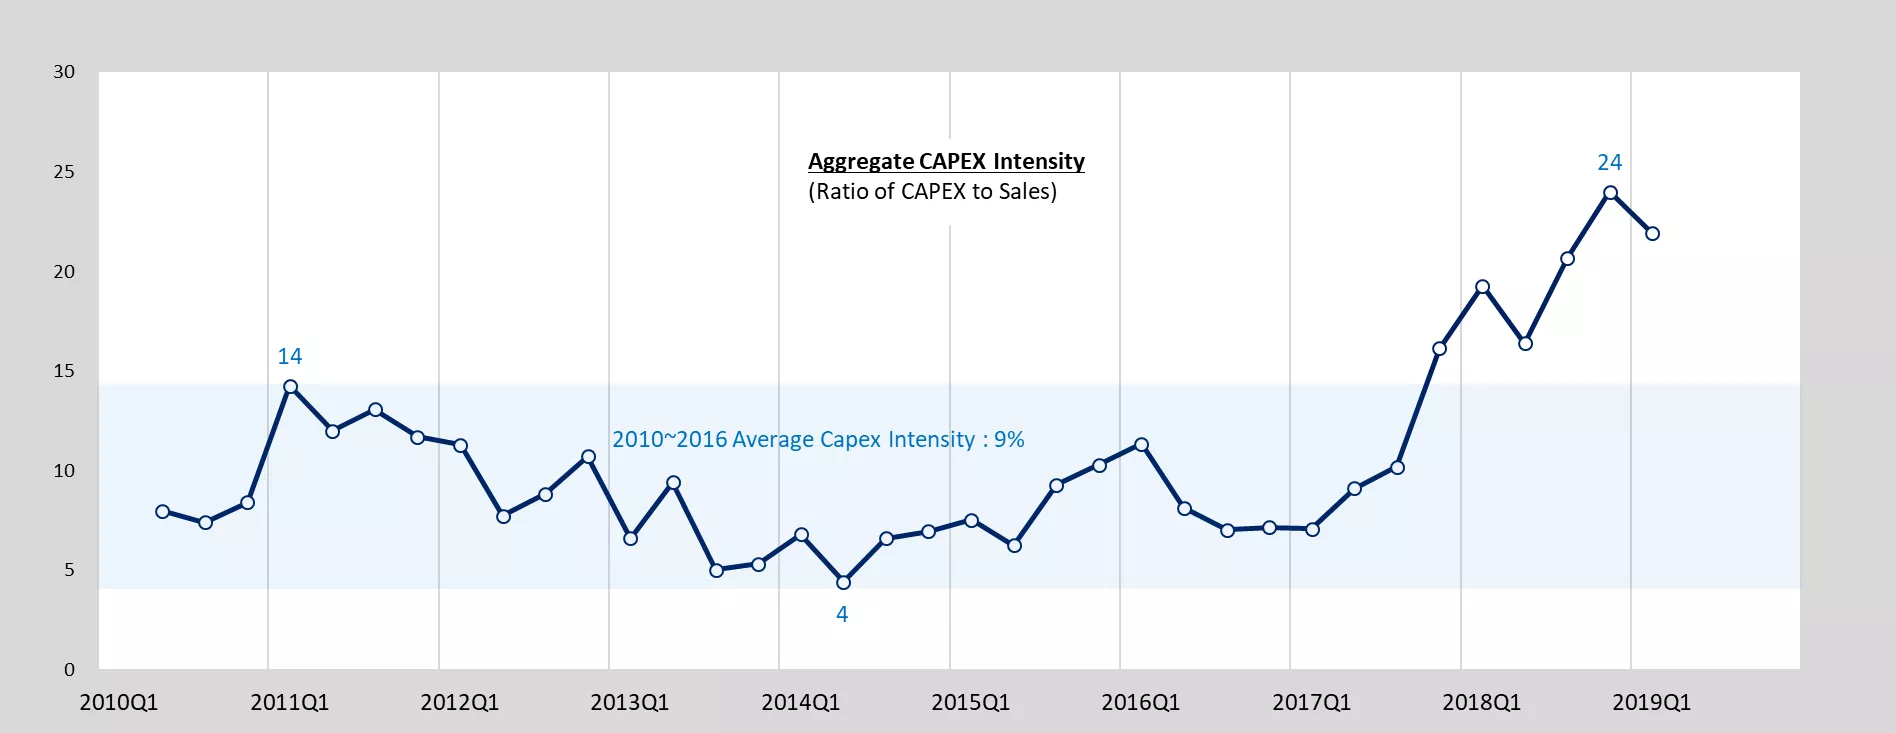
In addition, aggressive facility investments driven by both record low days of inventory and expectations for a prolonged semiconductor supercycle have made matters worse for wafer suppliers. As shown in Figure 3, aggregate CAPEX intensity, the ratio of CAPEX to sales, has greatly exceeded historic levels the past two years. The upshot is that total operating profit is expected to decline due to lower utilization and higher fixed costs for capital outlays. The best option for maintaining operating profit is to increase prices. However, even maintaining current pricing given the market softness and the resulting underutilization is difficult.
Figure 3 - Aggregate CAPEX Intensity
Remarks
- Data source: Each Company’s Financial Data
- CAPEX of companies which do not release CAPEX details were assumed based on their financials and industry data
- All currency exchange rates were calculated on the basis of quarterly average value released by FRED
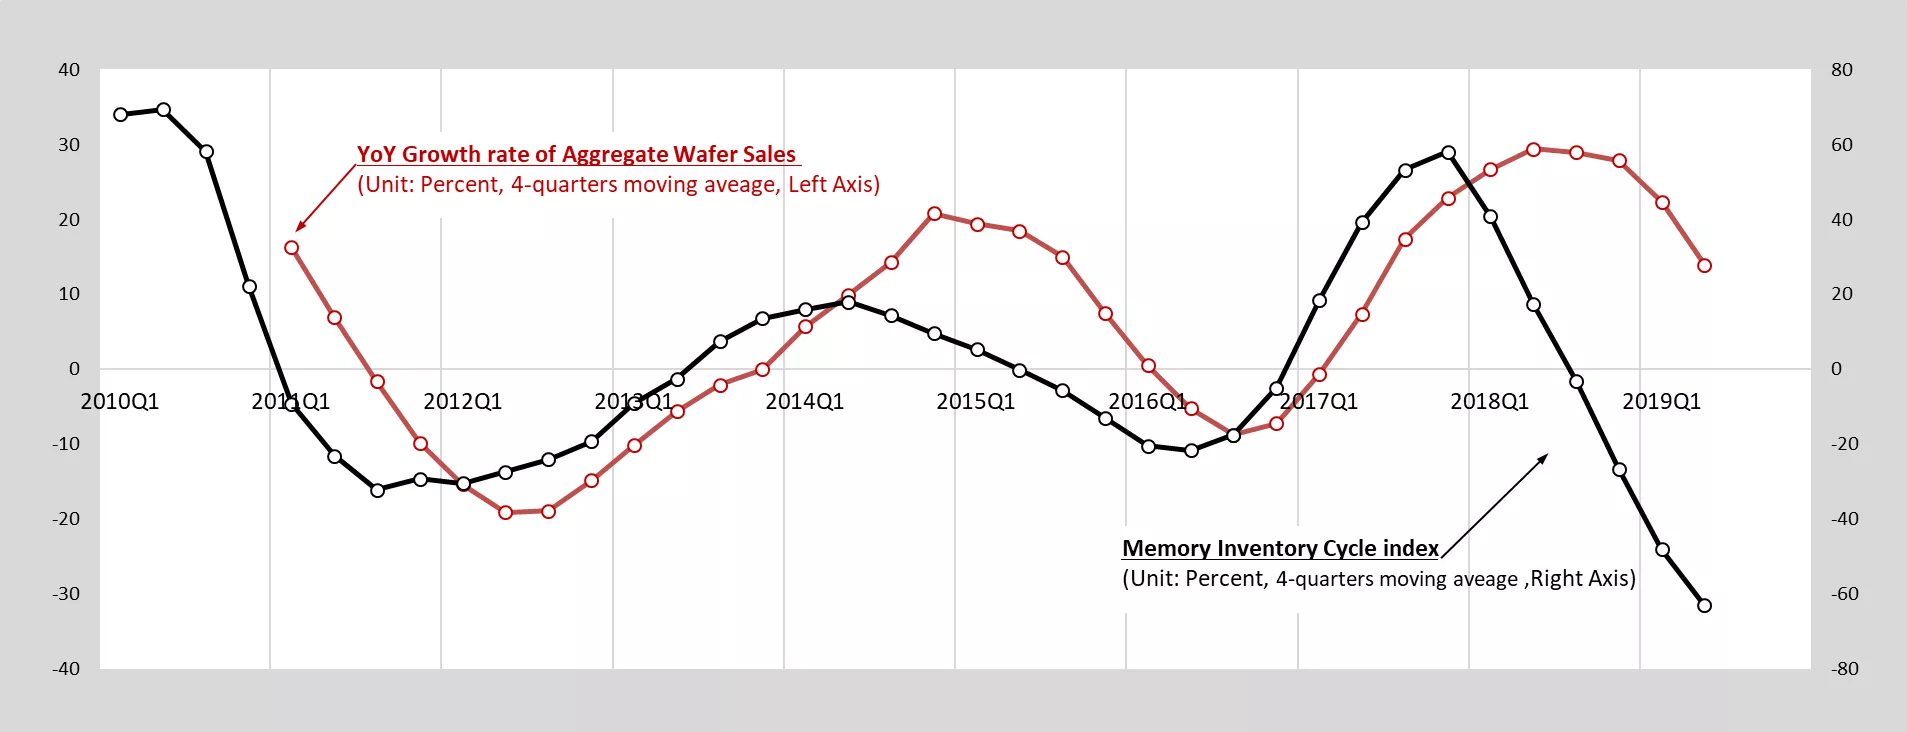
Figure 4 shows the comparison of year-over-over growth rates of silicon wafer sales and the memory inventory cycle index. The index is the difference between the year-over-over growth rates of sales and inventories. The memory inventory cycle index continued to decline the past few quarters and is now much lower than the bottoms of the previous cycles in 2011 and 2016. With the memory inventory correction expected to continue for the rest of this year, we don’t expect to see the wafer sales growth rate recover before the memory inventory cycle index, which requires memory inventory levels to normalize first.
Figure 4 - Comparison of Year-over-Year Growth Rates of Aggregate Wafer Sales and Memory Inventory Cycle Index
Remarks
- Data source: Each Company’s Financial Data
- All data of sales and inventory were calculated based on a four-quarter moving average of sales and inventory.
- Memory sales revenue and inventories are the sum of three Memory companies: Samsung, SK Hynix, Micron.
- Memory Inventory Cycle Index = YoY growth rate of memory sales revenues - YoY growth rate of memory total inventories value.
- All currency exchange rates were calculated on the basis of quarterly average value released by FRED.
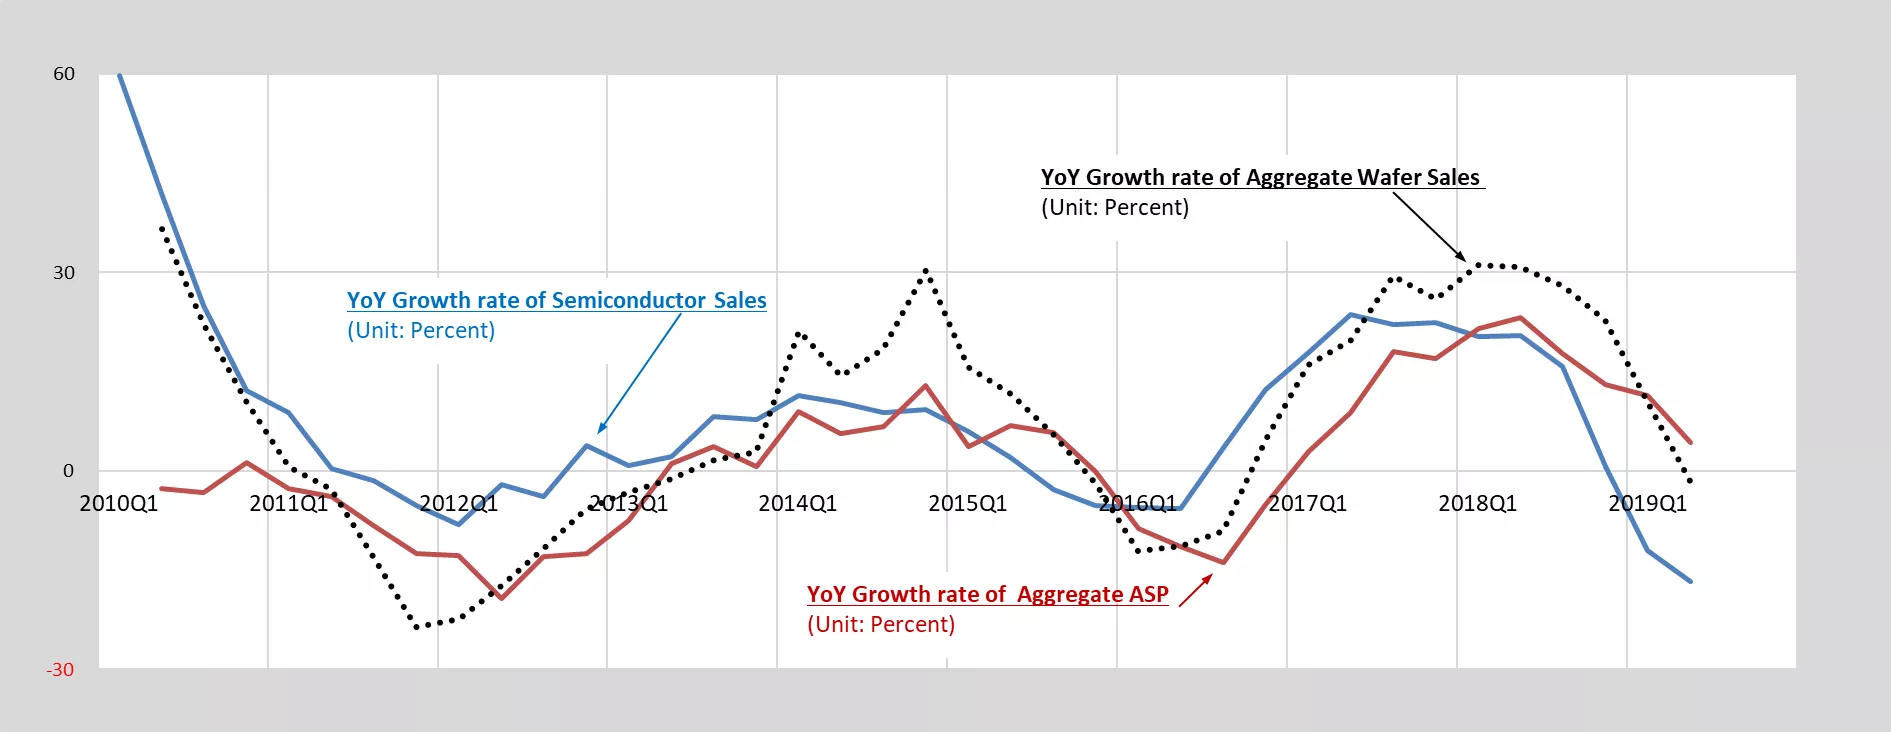
Figure 5 summarizes the dynamics described above. Generally, the year-over-year growth rate of semiconductor sales trends with the year-over-year growth rate of silicon wafer sales and silicon average selling price. Since the first quarter of 2017, both the year-over-year growth rate of aggregate silicon average selling price and aggregate revenue increased. However, year-over-year semiconductor sales fell into negative growth territory in the first quarter of 2019. Both aggregate wafer sales and average pricing are expected to follow the decline, particularly with low wafer demand in the memory market accounting for the highest portion of 300mm wafer demand.
Figure 5 - Comparison of Year-over-Year Growth Rates of Aggregate Sales, ASP, and Semiconductor Sales
Remarks
- Data source: WSTS Bluebook, SEMI Silicon Shipments Statistics and Each Company’s Financial Data
- Aggregate ASP is the ratio of aggregate sales revenue to total silicon wafer area shipments by SEMI
The semiconductor silicon wafer market slowdown follows two years of strong growth, and wafer companies are now trying to maintain contract prices in the face of downward pressure from chipmakers. The wafer market climate is tenuous at best given rising trade and geopolitical tensions and softness in memory demand. The fallout for most wafer manufacturers will be declining revenue, profits and capacity utilization.
The likelihood that wafer makers can continue to depress utilization is low because of the aggressive capital outlays over the past two years. The pressure to increase utilization could intensify in the second half of the year as re-negotiations of 2020 silicon volumes and pricing kick off. If the memory inventory correction persists for the rest of this year, wafer makers will likely focus on increasing capacity utilization and adjusting pricing strategies. With the pressure on wafer makers to maintain revenue targets in 2020, falling average selling prices will probably offset any potential lift to revenue from shipment growth.
Sungho Yoon is senior research manager in the Industry Research & Statistics Group at SEMI.