Global Growth Slows in Fourth Quarter
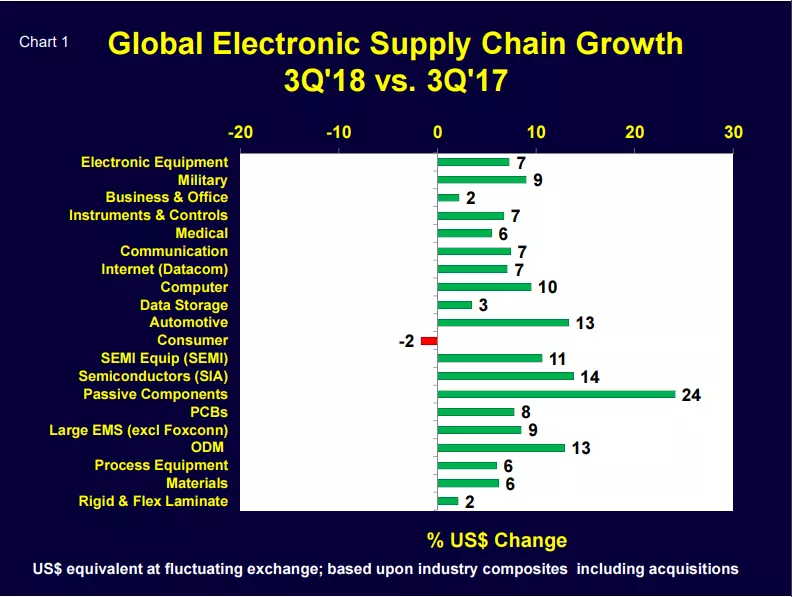
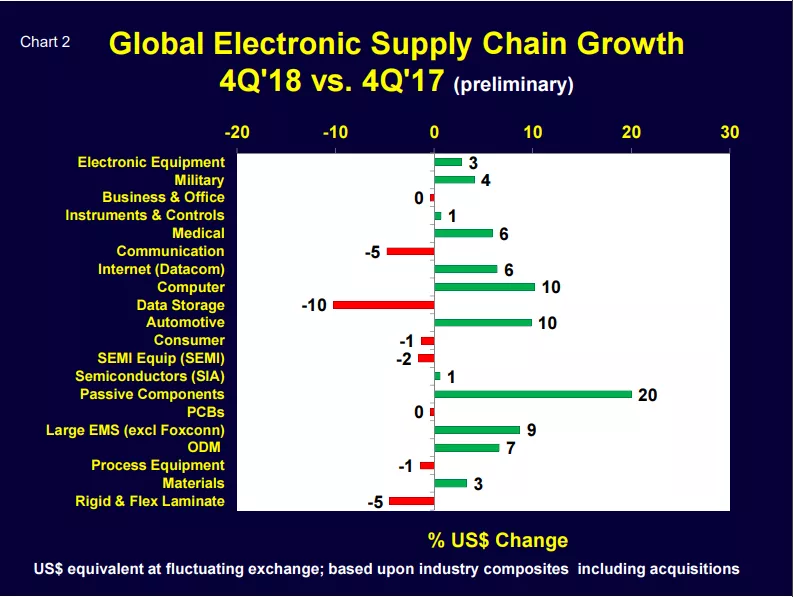
World electronic industry growth moderated (or contracted) in many sectors in late 2018. Compare Chart 1 (3Q’18 vs.3Q’17) to Chart 2 (4Q’18 vs.4Q’17). The length and color of the bars tell the story. The semiconductor industry felt more of a fourth-quarter slowdown than the end markets. Semiconductor-related products are typically much more volatile than the electronic equipment markets they serve.
In the third quarter of 2018 SEMI equipment shipments were up 10.6 percent and semiconductors grew 15.2 percent compared to the same quarter in 2017. By comparison, in 4Q’18 SEMI capital equipment shipments declined 1.6 percent and semiconductor shipments rose only 0.6 percent. For the month of December 2018 alone the results were even more sobering – SEMI equipment down 8.9 percent and semiconductors down 9.1 percent.
Such are the business cycles in the global electronics industry!
Electronic Equipment, Semiconductors and SEMI Equipment – Historical Growth Comparisons
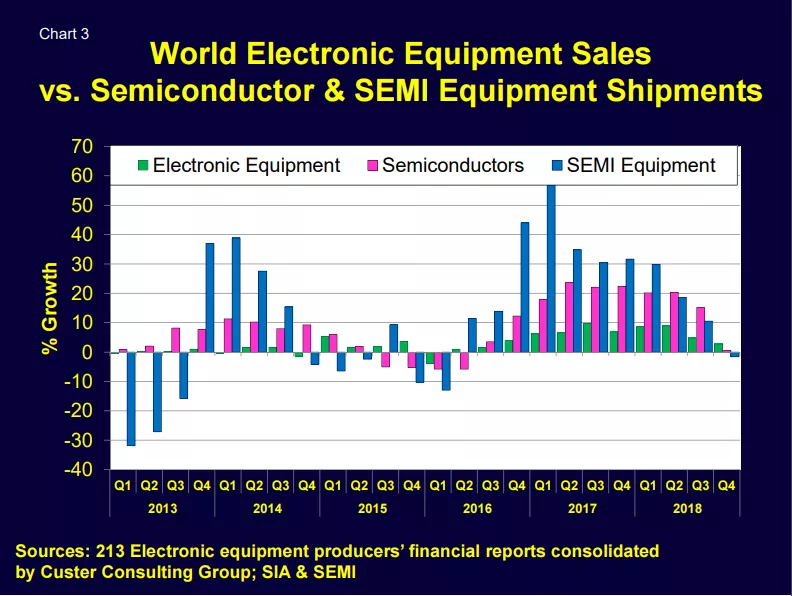
Chart 3 compares the quarterly growth of “end market” equipment to semiconductors and SEMI capital equipment for 2013 through 2018. Notice the much higher volatility of SEMI equipment in the peaks and troughs of the business cycle.
Leading Indicators
Predicting the future performance of our very volatile electronics business cycle is an important challenge. Taiwan wafer fab sales and Purchasing Manager Indices are two useful tools.
Wafer Foundries
Chart 4 compares the composite monthly sales of 14 Taiwan-listed wafer fabs to global semiconductor sales. The foundry composite predicts a further decline in chip sales short term. Taiwan-listed companies report their monthly revenues about 10 days after month-close, so they can be a very timely indicator of industry performance.
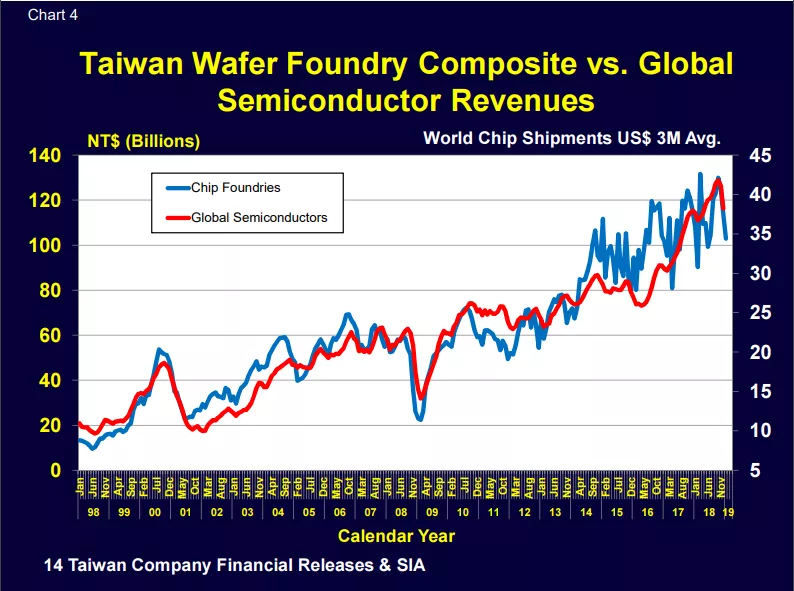
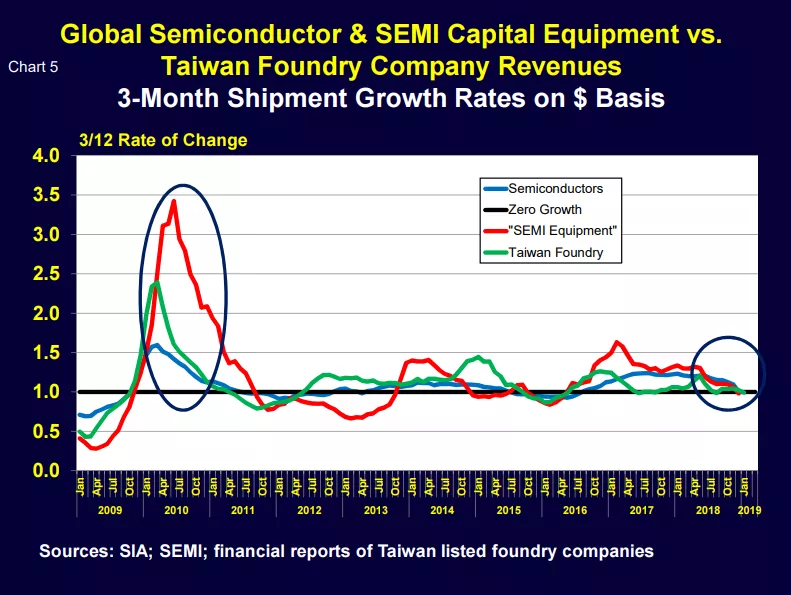
Chart 5 compares the 3/12 growth of these wafer foundries to global semiconductor and SEMI equipment shipments. The data point to further slowing ahead.
Purchasing Managers Indices
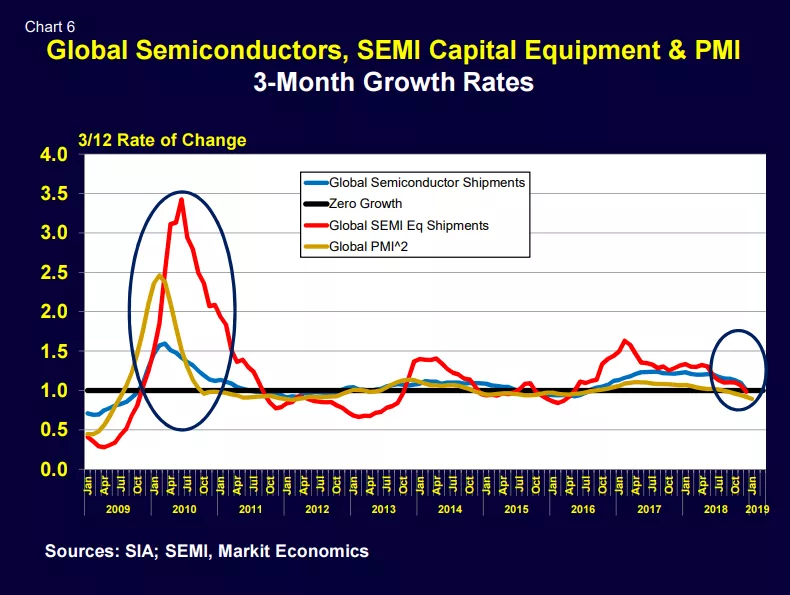
Chart 6 compares the 3/12 growth of semiconductors, SEMI equipment and the Global Purchasing Managers Index. The PMI also points to a softer market ahead.
This leading indicator methodology can be useful in forecasting individual company sales. For details contact walt@custerconsulting.com.
Walt Custer of Custer Consulting Group is an analyst focused on the global electronics industry.