
Business Conditions
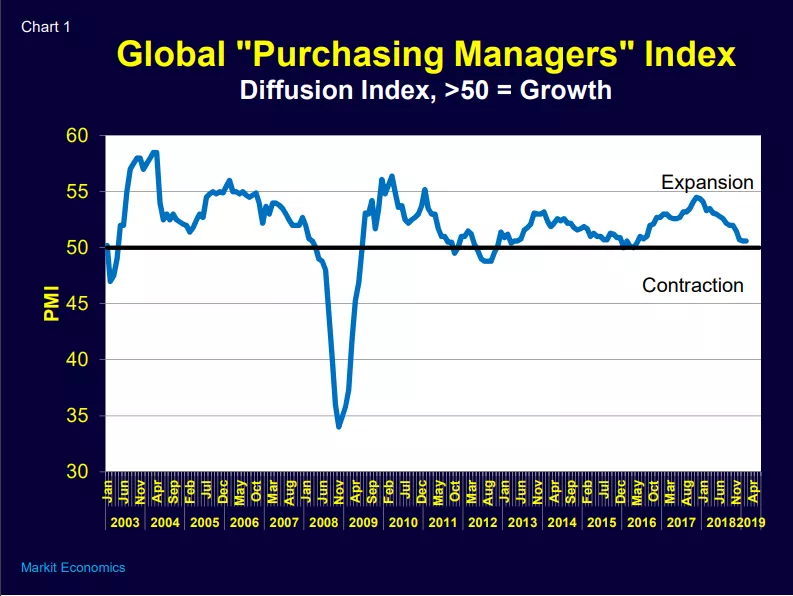
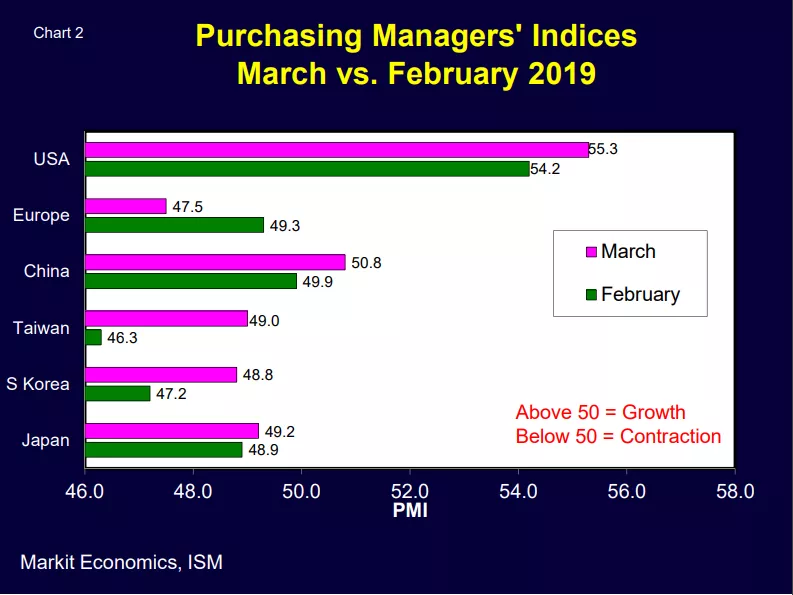
Manufacturing growth remains slow globally (Chart 1) although conditions vary by country and region (Chart 2).
- The United States is leading most countries in its rate of manufacturing expansion.
- Europe is struggling, with its largest producer Germany well into contraction.
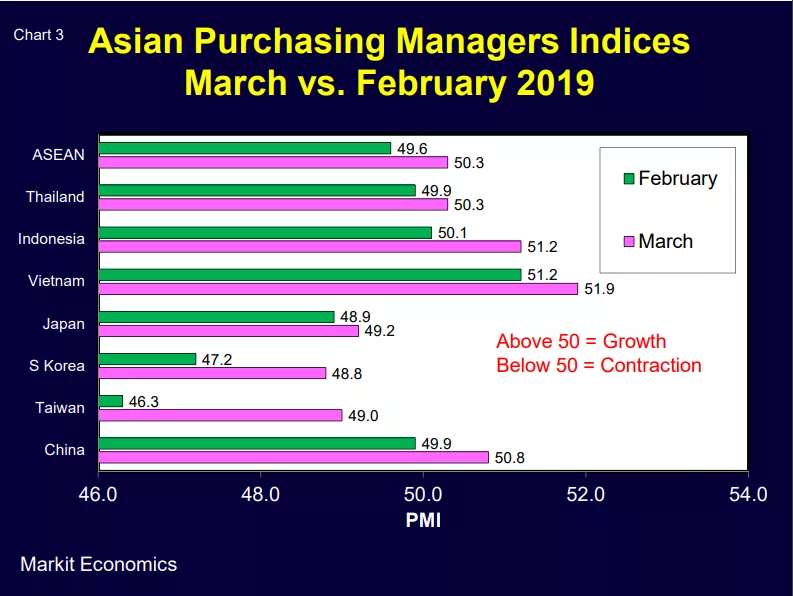
- Asia (Chart 3) has shown a modest improvement. In March China moved back (slightly) into expansion territory and Taiwan, South Korea and Japan reported improved PMIs, bringing them closer to regaining manufacturing growth.
Electronic Supply Chain Growth
Two key variables are in play – seasonality and year-on-year demand changes.
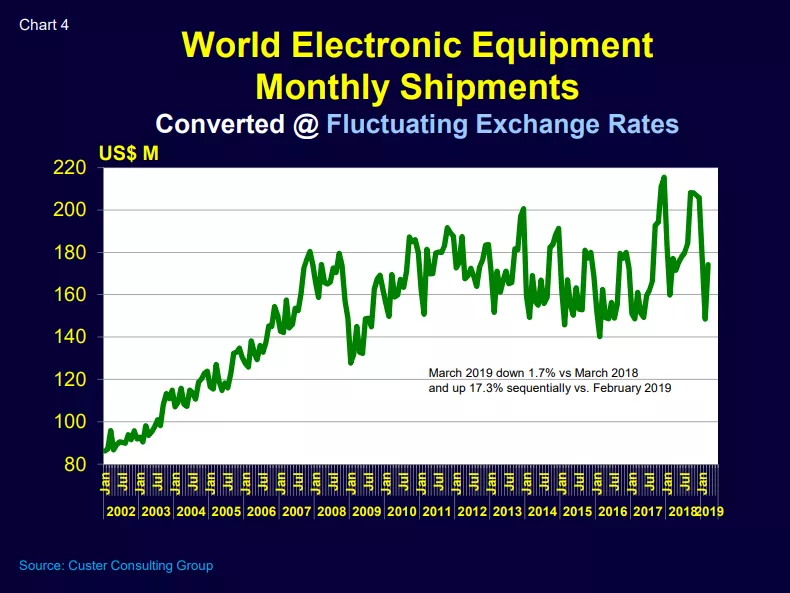
Chart 4 shows world monthly electronic shipments from 2002 to present. Notice the peaks each autumn as consumer driven goods are produced and sold in the winter holiday season. After a robust autumn, demand then drops sharply in January and February.
We have just experienced the normal winter annual slowdown and are now beginning the seasonal recovery. March 2019 electronic equipment shipments were down 1.7 percent versus March 2018 but up 17.3 percent sequentially versus February 2019. This implies that real end-market demand compared to a year ago is few percent lower but that the seasonal recovery is well underway.
Electronic Equipment Demand
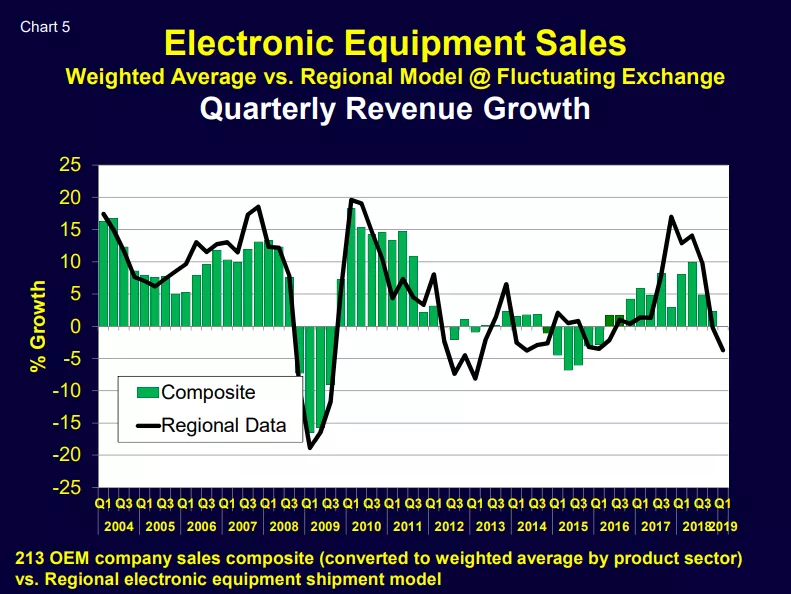
Based on Chart 5, electronic equipment sales are contracting and may take two to three quarters to recover.
Making Sense of the Data
To eliminate the impact of seasonality on our monthly data we can use 3/12 growth analyses comparing relative volumes for 3-month periods a year apart. These 3/12 values are unit-less and effectively take out seasonality – showing just comparative real growth rates by product.
Chart 6 compares the 3/12 growth rates of global semiconductor and SEMI equipment shipments and Taiwan chip foundry sales. All series are currently contracting – having 3/12 growth rates below 1.0.
Based on Chart 6:
- Semiconductor and Taiwan foundry monthly sales cycles are almost coincident timewise but foundry sales are more volatile.
- Both semiconductor and foundry sales lead SEMI equipment shipments – which are even more volatile.
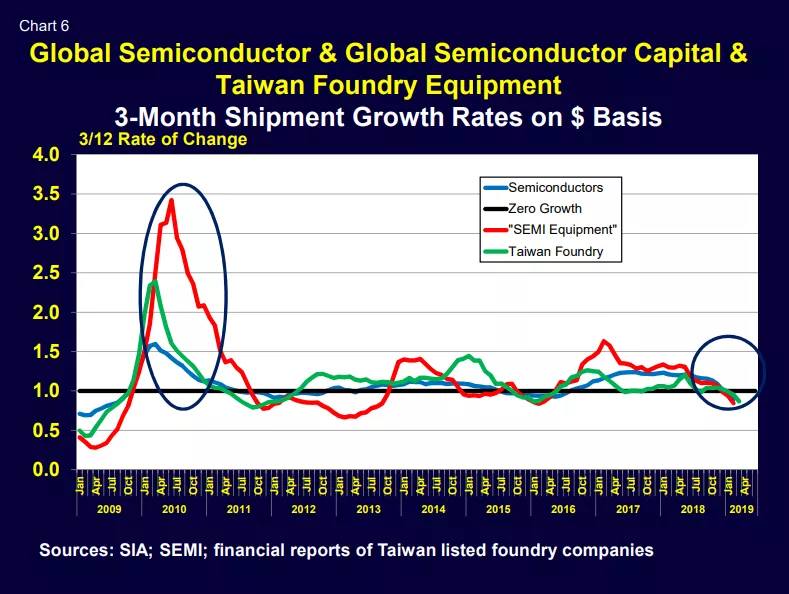
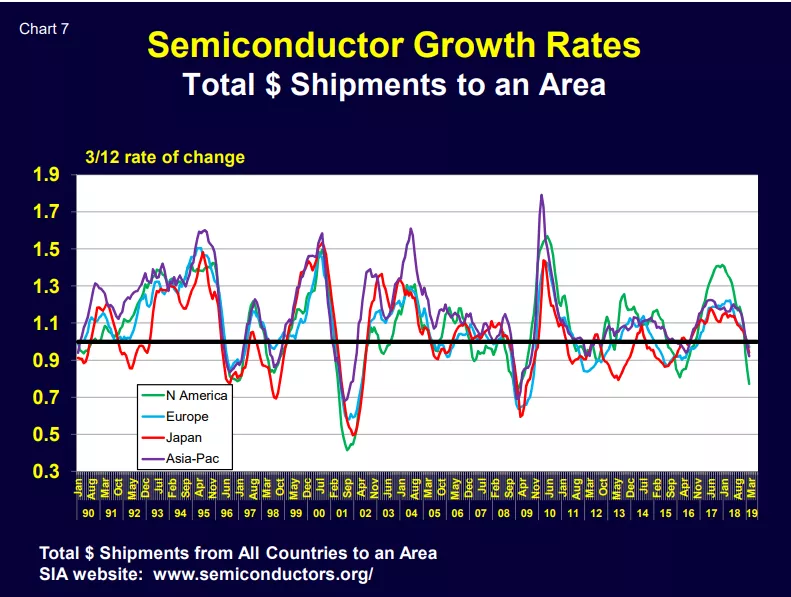
Chart 7 shows that semiconductor shipment growth is still contracting globally on a 3/12 basis, but (per Chart 8) foundry shipments recovered a bit in March. This suggests that SEMI equipment monthly revenues will continue to contract at least short term – until foundry sales signal increased chip demand followed by renewed SEMI equipment shipment growth.
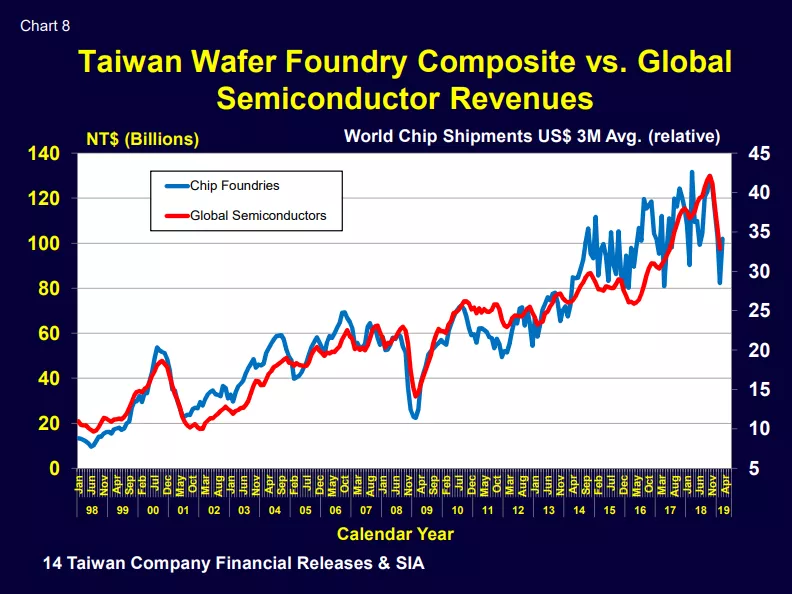
The turnaround is not “around the corner” but at least we can follow its progress!
Walt Custer of Custer Consulting Group is an analyst focused on the global electronics industry.